

Created by professional traders who wanted a better path for serious traders. Fair rules, live trade plans, fast payouts, and support built for growth.
Joined April 2025
- Tweets1.2K
- Following164
- Followers198
- Likes469





Today is the first trading day of November 📅
Since 2001, it’s been up 17 of 25 times for the S&P 500 and Nasdaq (68%), 16 of 25 for the Dow (64%).
Nov–Jan is the best 3-month stretch: Nasdaq +6.1%, S&P/Dow +4.4%.
via @AlmanacTrader
#November #Seasonality

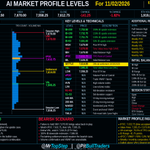
ES Market Profile for Mon 11/2 📊
Friday: open 7,669.50, high 7,670.00, low 7,558.25, close 7,612.75 (-1.82%)
VAH 7,670 | tPOC 7,632.75 | VAL 7,595.25
Bull: hold 7,614, reclaim 7,670
Bear: lose VAL, eyes on 7,558
#ES #MarketProfile

Live Futures Trading with Manny Nov. 2 teapawt.net/i/broadcasts/2jPBWzzjX…

Trey Talk | Swing Trading the Week Ahead (3) teapawt.net/i/broadcasts/2XyJBYQpP…
Five of the Magnificent 7 have reported. Estimated market cap changes from each earnings-day close through Oct 29: 💥
Alphabet (Oct 28): -19.78%, about -$504.7B
Meta (Oct 21): -11.09%, about -$186.9B. Strong results, but heavy spending caused anxiety.
Amazon (Oct 29): -7.96%, about -$178.9B. Net income topped $20B, but free cash flow plunged (a $42.4B outflow over the trailing 12 months).
Microsoft (Oct 28): -2.45%
Tesla (Oct 21): +7.48%, about +$66.5B
The graphic’s combined estimated net market cap loss is $810.5B.
These are estimates. Amazon uses an Oct 29 after-hours price of about $227.21 vs a $243.79 close, so it’s indicative, not final. The other names use Oct 29 closes. Share counts are held roughly constant, and the comparison windows differ.
#Mag7 #Earnings #Alphabet #Meta #Amazon #Microsoft #Tesla #Stocks #PitBullTraders #MrTopStep

Market cap change, Oct 13 to Oct 29, 2026, for five of the Magnificent 7: 📉
Alphabet: -19.78% (-$859.8B), from $4.35T to $3.49T
Meta: -16.51% (-$353.2B)
Amazon: -5.72% (-$159.6B)
Microsoft: -2.45% (-$98.9B)
Tesla: +7.48% (+$110.9B)
The combined net market cap loss across those five is $1.36 trillion, and only Tesla is higher. How many of the Magnificent 7 are still leading this market?
#Mag7 #MarketCap #Alphabet #Meta #Amazon #Microsoft #Tesla #PitBullTraders #MrTopStep

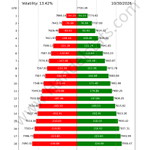
How far can the SPX travel? Here’s the implied move, day by day 🎯
1 day: ±54.23 (7,666.16 to 7,774.62)
5 days: ±121.26 (7,599.13 to 7,841.65)
9 days: ±162.69 (7,557.70 to 7,883.08)
All of it is based on 13.42% implied volatility from Thursday’s 7,720.39 close. Useful for sizing strikes and setting realistic expectations.
Credit: @HandelStats
#MrTopStep #PitbullTraders #SPX #Options #Volatility #Trading

After the bell, ES moved 43 points in just 15 minutes 👀
That’s more than the entire cash session range, and the biggest post-close 15-minute move in the last 30 days.
The chart breaks down opening range, first hour, last hour and post-close ranges for ES, NQ, RTY and YM, against their 5, 10 and 30-day averages. It shows what a normal day looks like and when today is anything but.
Credit: @HandelStats
#MrTopStep #PitbullTraders #ES #Futures #MarketStats #DayTrading #Trading

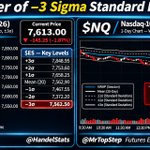
Where can price go today? Here are the 1 SD ranges from implied volatility 📈
ES: 7,664.16 to 7,765.84 (IV 12.59%)
NQ: 28,861.10 to 29,501.40 (IV 20.96%)
RTY: 2,844.69 to 2,896.11 (IV 17.11%)
YM: 52,125.20 to 52,858.80 (IV 13.35%)
The +2 SD and -2 SD levels are on the chart too. Moves outside the 1 SD range are the exception, not the rule.
Credit: @HandelStats
#MrTopStep #PitbullTraders #ES #NQ #RTY #YM #Volatility #Futures #Trading

Where can price go today? Here are the 1 SD ranges from implied volatility 📈
ES: 7,664.16 to 7,765.84 (IV 12.59%)
NQ: 28,861.10 to 29,501.40 (IV 20.96%)
RTY: 2,844.69 to 2,896.11 (IV 17.11%)
YM: 52,125.20 to 52,858.80 (IV 13.35%)
The +2 SD and -2 SD levels are on the chart too. Moves outside the 1 SD range are the exception, not the rule.
Credit: @HandelStats
#MrTopStep #PitbullTraders #ES #NQ #RTY #YM #Volatility #Futures #Trading

Friday’s pivots are in 📊
ES: Pivot 7,731.50 | R1 7,750.75 | S1 7,695.75
NQ: Pivot 29,323.08 | R1 29,535.17 | S1 28,969.17
After the bell, ES settled at 7,715.00 and NQ at 29,181.25. Both are trading below their pivots.
Big picture: SPX is 1.6% below its 52-week high of 7,844.52. NDX is 6.25% below its high of 31,361.37.
Know your levels before the open.
Credit: @HandelStats
#MrTopStep #PitbullTraders #ES #NQ #SPX #Futures #DayTrading #Trading

Rich Handelstats teapawt.net/i/broadcasts/1DGleVAMq…


97 years since Black Tuesday (Oct 29, 1929), on record volume of ~16.4M shares. Biggest one-day Dow drops: 1) Black Monday 1987 -22.61%, 2) COVID crash 2020 -12.93%, 3) Oct 28, 1929 -12.82%, 4) Black Tuesday -11.73%. #MarketHistory

$ESZ26 Wednesday: +26.25 (+0.34%) to 7,784.50. Range 7,751.50-7,794.25. Settled 7,783.25, above VAH 7,779.00. tPOC 7,771.00 / VAL 7,761.00. Bull: hold settlement, then 7,794.25 and 7,803.00. Bear: lose VAH, then tPOC and VAL 7,761.00. #ES #MarketProfile

Tom Incorvia: Market Profile teapawt.net/i/broadcasts/1dxYlaZLR…