

Publication quality weather maps in seconds. Pyre is a Climatology Reanalysis mapping site using CORe data. Help us get better with feedback!
Pittsburgh, PA
Joined October 2026
- Tweets297
- Following278
- Followers132
- Likes476
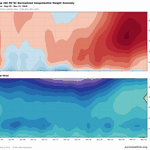




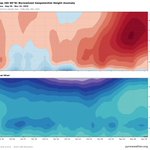

BOOM! Here it is!! That little green wedge on the right side of the lower image? that's the easterly turn of the 10mb winds at 60N Latitude.
The Sudden Stratospheric Warming event has officially arrived!!
@Statisticizer

Rapidly rising height anomalies in the stratosphere (heavy read blobs on the right) along with weakening westerlies (light blue bubble right side) foretell a sudden warming event in the stratosphere. This data lags by about 24 hours, but the reversal has already been reported.

1
21

WOOF

Remember that NAM memorial? About that… 📷
WOOF-NAM is now FREE in WeatherWise.
It’s a 12 km version of the NAM that starts from GFS analysis and runs on GPUs, so its forecasts can differ from the original NAM.
Open WeatherWise → Models → WOOF-NAM to check it out. No Pro subscription needed.
Huge thanks to @recast for making the model data available!

2
135


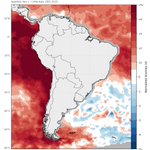
Would filling the ocean with a darker gray than land imrpove readability or just add ink (pixels) where not needed?
This is an artifact of the data, and anyone using CORe will experience it.
CORe is not ideal for SST research, but when comparing to the past
(cont)
1
42


On the verge of a SSW event.
Oct 1–25: Strong westerlies in the upper stratosphere,Oct 27–Nov 6: Polar cap geopotential heights are strongly positive. Nov 1–10: Westerlies at 60°N weaken, esp. btwn 10 and 50 hPa. But remain positive (westerly), rather than reversing to easterly.

50mb GPH: There is a single, well-defined low-height circulation displaced toward northern Eurasia, not two separated vortex centers. A displacement-type disturbance, not a split.

1
43
10-hPa zonal wind: Strong westerlies along parts of the vortex perimeter, esp. over the North Atlantic–European sector. Easterly winds across portions of the polar interior. Consistent with a disturbed vortex, but no zonal-mean reversal required for a major SSW.

1
32
Feature update: the 'minus' feature we posted about last week was flawed, but it wasn't getting any use so now it's corrected and fabulous!
Can anyone guess what this map is showing, and what sort of argument might it support? Is it statistically valid for that?

Here is a little case study of Northern Hemisphere teleconnection patterns. I'm not an expert with these, I just love making maps. But this is pretty cool.
2009-2010 Winter (DJF), had a positive Niño index, and the composite anomaly of 500mb showed a typical neg NAO (cont)

1997 -98 had a much stronger niño index, above 2, and the anomaly pattern is much more like a + PNA pattern with the just stream furtehr south overall and significantly more precip concentrated in the south

1
80