

Equipping the progressive movement with the data and insights it needs to win.
- Tweets11.8K
- Following11
- Followers68.9K
- Likes2K
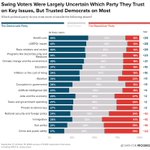




ALT Data for Progress chart: which party swing voters trust more on 17 issues. Figures are % Democrats / don’t know / Republicans. Health care 44/41/15. LGBTQ+ issues 41/45/13. Race relations and racism 40/45/14. Social Security and Medicare 41/41/18. Climate change and the environment 39/43/18. Education 37/45/18. Inflation or cost of living 34/47/19. Abortion 34/42/23. Corruption in government 26/58/15. AI 23/59/19. Jobs and the economy 29/43/27. Taxes and government spending 27/48/25. Threats to democracy 27/48/25. National security and foreign policy 24/42/34. Immigration 26/33/41. Gun policy 21/40/39. Crime and public safety 17/44/39. Source: Sept. 11–Oct. 19, 2026 surveys of 5,930 respondents, including 428 swing voters.


ALT Bar chart of polling data from Data For Progress. Title: Voters Disapprove of Vice President JD Vance and Former President Richard Nixon. Description: Do you have a favorable or unfavorable opinion of the following people or institutions? <strong>Vice President JD Vance</strong> — Favorable: 42%, Unfavorable: 50% <strong>Former U.S. President Richard Nixon</strong> — Favorable: 32%, Unfavorable: 56% October 23–26, 2026 survey of 1,214 U.S. likely voters.


ALT Split chart of Data for Progress polling. Title: Democrats Were Associated More With Economic Populist Messaging Than Moderate Messaging. Question: How often, if at all, have you heard Democratic candidates say each of the following during this year's election campaigns? Results by party (Dem / Ind / Rep): Billionaires and the wealthy should pay more in taxes: 84% / 80% / 71% Big corporations are raising prices to boost their profits: 80% / 70% / 62% Corporate landlords are driving up rents and should be stopped: 71% / 60% / 59% We should use every source of American energy, including oil, gas, and renewables, to lower energy costs: 61% / 43% / 39% We need to secure the border and enforce immigration laws: 51% / 33% / 39% Democrats will work with Republicans to get things done: 52% / 31% / 23% Oct. 31–Nov. 3, 2026 survey of 1,188 U.S. likely voters.

ALT Split chart of polling data from Data For Progress. Title: Voters in Texas, Michigan, and Maine Supported a Progressive Policy Agenda. Description: Do you support or oppose each of the following proposals? Add a federal income tax of 10% on income over $1 million — TX: 59%, MI: 65%, ME: 76% Raise the minimum wage to $15 an hour nationwide — TX: 69%, MI: 69%, ME: 72% Pause the construction of new artificial intelligence (AI) data centers for at least one year — TX: 58%, MI: 69%, ME: 68% Require oil and gas companies to pay a share of costs for climate change-driven disaster damages — TX: 61%, MI: 68%, ME: 68% Create a Medicare for All health care system, which would guarantee healthcare for all Americans, replacing most private insurance with a government-funded plan — TX: 58%, MI: 57%, ME: 63% Stop providing military aid and weapons to Israel — TX: 49%, MI: 54%, ME: 62% October 23–25, 2026 survey of 574 Michigan likely voters; October 23–26, 2026 survey of 712 Texas likely voters; Oct

ALT Bar chart of Data for Progress polling. Title: Ahead of the Election, Voters Were Hearing Most About Cost of Living, Iran, and AI. Share of likely voters who have heard "a lot" about each topic in the news recently: cost of living 66%, the war with Iran 57%, AI 55%, data centers 52%, immigration and deportations 48%, corruption allegations in the Trump administration 44%, Flock Safety license-plate cameras 34%, protests and riots in France 32%, federal Medicaid cuts 31%, the World Series 26%, the Fed raising interest rates 19%, and You Can See Everything, a new Elizabeth Holmes movie, 7% (50% have heard nothing at all). October 31–November 3, 2026 survey of 1,188 U.S. likely voters.


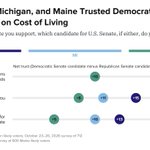
ALT Bar chart titled “Democrats Lead in ME, MI, and TX Senate Races.” In Maine, Democrat Troy Jackson leads Republican Susan Collins 50% to 45% (+5). In Michigan, Democrat Abdul El-Sayed leads Republican Mike Rogers 50% to 46% (+4). In Texas, Democrat James Talarico leads Republican Ken Paxton 49% to 45% (+4). Third-party candidates and undecided voters are shown in the crosstabs. Data for Progress surveys of 652 likely voters in Maine (October 23–27, 2026), 622 likely voters in Michigan (October 23–25, 2026), and 712 likely voters in Texas (October 23–26, 2026).

ALT Bar chart titled “Democrats Lead in ME and MI Races for Governor, Trail Narrowly in TX.” In Michigan, Democrat Jocelyn Benson leads Republican John James 52% to 43% (+9). In Maine, Democrat Hannah Pingree leads Republican Robert Charles 49% to 37% (+12), with independent Rick Bennett at 7%. In Texas, Republican Greg Abbott leads Democrat Gina Hinojosa 48% to 47% (+1). Third-party candidates and undecided voters are shown in the crosstabs. Data for Progress surveys of 652 likely voters in Maine (October 23–27, 2026), 622 likely voters in Michigan (October 23–25, 2026), and 712 likely voters in Texas (October 23–26, 2026).

ALT Bar chart of polling data from Data For Progress. Title: Voters Have a Negative Opinion of Private Jet Use for Transporting Celebrities, Politicians, and Wealthy People for Leisure. Description: Do you have a positive or negative opinion of private jets being used for each of the following purposes? To transport medical patients or medical materials (such as organ donations) for medical emergencies — Positive: 84%, Negative: 8% To deliver disaster relief supplies, rescue crews, and evacuees to areas commercial flights can't reach — Positive: 83%, Negative: 8% To transport sports teams for sporting events — Positive: 50%, Negative: 36% To transport animals, including pet dogs and race horses — Positive: 46%, Negative: 36% <strong>[SPLIT A]</strong> To transport company executives for business purposes — Positive: 39%, Negative: 46% To transport celebrities to events, such as concerts — Positive: 33%, Negative: 52% To transport politicians to campaign events — Positive: 32% Negative: 53%


ALT Bar chart of polling data from Data For Progress. Title: Socially Disengaged Americans Are Less Trusting in the Government. Description: How much do you agree or disagree with the following statements?— The government looks out for people like me. All U.S. adults — Agree: 27%, Disagree: 63% Very low — Agree: 16%, Disagree: 68% Low — Agree: 24%, Disagree: 64% Medium — Agree: 31%, Disagree: 69% High — Agree: 53%, Disagree: 45% September 4–9, 2026 survey of 1,098 U.S. adults.

ALT Bar chart of polling data from Data For Progress. Title: Socially Disengaged Americans Are Less Likely to Believe They Can Make a Difference in Politics. Description: How much do you agree or disagree with the following statements?— People like me can actually make a difference in our political system. All U.S. adults — Agree: 54%, Disagree: 33% Very low — Agree: 42%, Disagree: 37% Low — Agree: 57%, Disagree: 29% Medium — Agree: 62%, Disagree: 32% High — Agree: 65%, Disagree: 32% September 4–9, 2026 survey of 1,098 U.S. adults.

ALT Bar chart of polling data from Data For Progress. Title: Most Voters, Including Majorities Across Partisanship, Support Offshore Wind Energy Projects. Description: Do you support or oppose offshore wind energy projects? All likely voters — Support: 61%, Oppose: 24% Democrat — Support: 65%, Oppose: 17% Independent / Third party — Support: 69%, Oppose: 21% Republican — Support: 54%, Oppose: 35% October 16–19, 2026 survey of 1,118 U.S. likely voters.


ALT Bar chart of polling data from Data For Progress. Title: Most Veterans In AZ and NC Say Their Voices in National Political Debates Are Represented Very Little or Not Well at All. Description: How well do you feel your voice and priorities are represented in national political debates? All veterans — Completely: 3%, Very well: 10%, Somewhat well: 24%, Very little: 33%, Not well at all: 24%, Not sure: 6% Democrat — Completely: 3%, Very well: 8%, Somewhat well: 24%, Very little: 43%, Not well at all: 20%, Not sure: 1% Independent / Third party — Completely: 0%, Very well: 4%, Somewhat well: 16%, Very little: 33%, Not well at all: 40%, Not sure: 7% Republican — Completely: 5%, Very well: 16%, Somewhat well: 32%, Very little: 28%, Not well at all: 11%, Not sure: 8% Under 45 — Completely: 2%, Very well: 21%, Somewhat well: 23%, Very little: 24%, Not well at all: 20%, Not sure: 10% 45+ — Completely: 3%, Very well: 7%, Somewhat well: 25%, Very little: 35%, Not well at all: 25%, Not sure: 5%

ALT Bar chart of polling data from Data For Progress. Title: Around 3 in 5 Veterans in AZ and NC Say the Country is On the Wrong Track. Description: Would you say things in the country are generally headed in the right direction, or are they off on the wrong track? All veterans — Right direction: 35%, Not sure: 7%, Wrong track: 59% Democrat — Right direction: 4%, Not sure: 3%, Wrong track: 93% Independent / Third party — Right direction: 16%, Not sure: 8%, Wrong track: 76% Republican — Right direction: 69%, Not sure: 7%, Wrong track: 24% Under 45 — Right direction: 30%, Not sure: 8%, Wrong track: 62% 45+ — Right direction: 36%, Not sure: 6%, Wrong track: 58% AZ — Right direction: 32%, Not sure: 6%, Wrong track: 61% NC — Right direction: 37%, Not sure: 7%, Wrong track: 57% October 9–19, 2026 survey of 597 U.S. veterans pooled across AZ and NC.

ALT Stacked bar chart from Data for Progress titled “Majorities of Voters Say Trump Hasn’t Kept Many of His Campaign Promises,” from an October 9–13, 2026 survey of 1,155 U.S. likely voters. For each promise, the share saying he has not kept it, then the shares saying fully kept and partly kept: Gas below $2: 70% not kept (8% fully, 10% partly). No more wars: 65% (9%, 14%). End inflation on day one: 63% (9%, 17%). End Russia-Ukraine war in 24 hours: 62% (9%, 15%). Cut energy prices in half: 60% (10%, 17%). Cut cost of a new home in half: 57% (9%, 17%). End veterans’ homelessness: 55% (10%, 16%). Cap credit card interest at 10%: 53% (11%, 15%). Dismantle the deep state: 51% (11%, 23%). Drive out government waste and fraud: 50% (13%, 23%). Tariffs a cost to other countries, not you: 46% (17%, 25%). Not touch Medicare or Social Security: 45% (21%, 18%). No taxes on tips: 31% (26%, 22%). Largest deportation operation: 23% (34%, 30%).

ALT Split chart of polling data from Data For Progress. Title: A Majority of Voters Across Party Lines Believe the Cost of Living Has Gotten Worse Since 2024. Description: Compared to 2024, would you say each of the following has gotten better, gotten worse, or stayed about the same? The cost of living — Democrat: 87%, Independent / Third party: 79%, Republican: 53% The economy overall — Democrat: 85%, Independent / Third party: 67%, Republican: 42% Political corruption — Democrat: 82%, Independent / Third party: 59%, Republican: 35% America's standing in the world — Democrat: 79%, Independent / Third party: 60%, Republican: 28% Civil rights, freedoms, and due process — Democrat: 78%, Independent / Third party: 50%, Republican: 21% Crime — Democrat: 58%, Independent / Third party: 39%, Republican: 28% Illegal immigration — Democrat: 42%, Independent / Third party: 29%, Republican: 24% October 9–13, 2026 survey of 1,155 U.S. likely voters.


ALT Alt text: Disabled voters report more financial strain than non-disabled voters. Very stressed financially: 45% of disabled voters and 25% of non-disabled voters. Household economic conditions rated poor: 42% of disabled voters and 22% of non-disabled voters. Country economic conditions rated poor: 44% of disabled voters and 31% of non-disabled voters. Community economic conditions rated poor: 32% of disabled voters and 19% of non-disabled voters. A survey of 1,118 U.S. likely voters conducted October 16 to 19, 2026.


ALT To investigate how different dimensions of socioeconomic status impact voters’ levels of financial stress, a Data for Progress survey asked voters to self-report their current amount of “financial stress,” and also measured six dimensions of socioeconomic status: household debt burden, household income, month-to-month income variability, network reliability in the event of job loss, self-described occupational prestige, and self-reported class identity. Voters were divided into “low,” “middle,” and “high” groups for each of these six indicators. Debt burden stands out clearly as most correlated with financial stress, with a correlation of 0.52 — by far the strongest relationship of any measure we tested. Self-reported class (-0.39) is the next strongest, followed by network reliability (-0.36) and income (-0.35). Occupational prestige and income variability are the least related to financial stress.


ALT Bar chart of polling data from Data For Progress. Title: Voters Support Transmission Lines for Clean Energy, but Oppose Them for AI Data Centers. Description: Transmission lines carry energy from one point of the electric power system to another. These lines are typically overhead, and they transport large quantities of high-voltage electricity over long distances. Suppose a new transmission line is proposed for your community. If you knew the transmission line was being built to connect [SPLIT A/SPLIT B] to the power grid, would you support or oppose this transmission project being built in your community? <strong>Split A:</strong> More clean energy — Support: 76%, Oppose: 15% <strong>Split B:</strong> More AI data centers — Support: 36%, Oppose: 56% October 9–13, 2026 survey of 1,155 U.S. likely voters.

ALT Bar chart of polling data from Data For Progress. Title: Voters Are Split on What Types of New Energy and Infrastructure Projects Will Lower Costs. Description: For each of the following types of energy and infrastructure projects, please say if you think building these will help lower costs. New clean energy projects — Building these will help lower costs: 51%, Don't know: 21%, Building these will not help lower costs: 28% New infrastructure like roads and bridges — Building these will help lower costs: 42%, Don't know: 22%, Building these will not help lower costs: 35% New large fossil fuel energy projects — Building these will help lower costs: 40%, Don't know: 24%, Building these will not help lower costs: 36% New electric transmission projects — Building these will help lower costs: 40%, Don't know: 27%, Building these will not help lower costs: 33% New data centers — Building these will help lower costs: 23%, Don't know: 20%, Building these will not help lower costs: 57%

ALT Dumbbell chart titled “Americans Trust Groups of People More if They Know Someone From That Group.” It compares the share of U.S. adults who trust each group among those who don’t personally know someone in it versus those who do. Trust is higher among people who know someone in every group, with gaps of 19 to 40 points: Disabled people: 73% (don’t know) vs. 92% (know), +19 Jewish people: 57% vs. 89%, +32 Your neighbors next door: 52% vs. 87%, +35 People who immigrated to the U.S. in the last 10 years: 56% vs. 87%, +31 People who have had an abortion: 58% vs. 86%, +28 Transgender people: 45% vs. 85%, +40 Gay, lesbian, or bisexual people: 44% vs. 84%, +40 Police officers: 62% vs. 82%, +20 Muslim people: 47% vs. 81%, +34 Evangelical Christians: 46% vs. 78%, +32 People who have been incarcerated in jail or prison: 34% vs. 66%, +32 Source: Data for Progress survey of 1,098 U.S. adults, September 4–9, 2026.


ALT Bar chart of polling data from Data for Progress. Title: A Strong Majority of Voters Across Party Lines Think Elected Officials Have Done Too Little to Prevent Sexual Assault. Question: In your opinion, do you think elected officials have done too much, too little, or the right amount to prevent sexual assault? Percentages listed as: too little, the right amount, too much, don't know. All likely voters: 71, 20, 3, 6 Democrat: 78, 16, 2, 4 Independent / Third party: 76, 12, 1, 10 Republican: 60, 29, 5, 6 Female: 77, 15, 2, 5 Male: 63, 26, 5, 6 Under 45: 59, 30, 8, 3 45+: 77, 15, 1, 7 Black or African American: 72, 17, 3, 8 White: 72, 19, 3, 6 Latino: 59, 33, 8, 0 October 9–13, 2026 survey of 1,155 U.S. likely voters.

ALT Bar chart of polling data from Data For Progress. Title: Voters Do Not Trust College Administrations, Elected Officials, or Fraternities and Sororities to Appropriately Respond to Sexual Assault Claims. Description: How much do you trust each of the following, if at all, to respond appropriately to claims of sexual assault? Hospitals — Trust: 86%, Don't trust: 12% Police departments — Trust: 70%, Don't trust: 27% College administrations — Trust: 42%, Don't trust: 52% Elected officials — Trust: 39%, Don't trust: 58% College sororities and fraternities — Trust: 26%, Don't trust: 67% October 9–13, 2026 survey of 1,155 U.S. likely voters.

ALT Bar chart titled “Peltola Leads Sullivan in Tight Race for U.S. Senator From Alaska.” The November 2026 general election for U.S. Senator from Alaska will be conducted using ranked choice voting. Voters were asked to rank up to four candidates, with 1 being their first choice and 4 being their last choice. If you are not sure, please rank that as your first option. First round ranked choice voting simulation for U.S. Senator from Alaska: Peltola, Mary (Registered Democrat), 47%; Sullivan, Dan S. (Registered Republican) Incumbent, 44%; Sullivan, Daniel J. Jr., 4%; Heikes, Gerald L. (Registered Republican), 1%; Not sure, 3%. Final round ranked choice voting simulation for U.S. Senator from Alaska, after eliminating Heikes and Sullivan Jr.: Peltola, Mary (Registered Democrat), 51%; Sullivan, Dan S. (Registered Republican) Incumbent, 49%. October 8–16, 2026 survey of 694 Alaska likely voters. Data for Progress.

ALT Bar chart titled “Begich Narrowly Leads Hill in Race for U.S. Representative From Alaska.” The November 2026 general election for U.S. Representative from Alaska will be conducted using ranked choice voting. Voters were asked to rank up to four candidates, with 1 being their first choice and 4 being their last choice. If you are not sure, please rank that as your first option. First round ranked choice voting simulation for U.S. Representative from Alaska: Begich, Nick (Registered Republican), 48%; Hill, Bill (Nonpartisan), 42%; Hafner, Eric (Registered Democrat), 5%; McDermott, James C. “Jim” (Registered Libertarian), 1%; Not sure, 4%. Final round ranked choice voting simulation for U.S. Representative from Alaska, after eliminating McDermott and Hafner: Begich, Nick (Registered Republican), 51%; Hill, Bill (Nonpartisan), 49%. October 8–16, 2026 survey of 694 Alaska likely voters. Data for Progress.

ALT Bar chart of polling data from Data For Progress. Title: Across Both Conditions of a Split Sample Test, Voters Strongly Support Individuals' Rights to Direct Action Against Insurance Companies. Description: Do you support or oppose individuals' rights to file lawsuits against insurance companies if they... ...deny, delay, or underpay home insurance claims payments? — Support: 84%, Oppose: 11% ...cancel coverage or raise the price without warning policyholders of the potential that they might do that? — Support: 82%, Oppose: 12% September 15–21, 2026 survey of 1,444 U.S. likely voters.


ALT Crosstab chart of polling data from Data For Progress. Title: Voters in Key States Are Less Likely to Vote for a Candidate Who Takes AI Super PAC Money. Description: Below are actions that a potential candidate for office might take. For each, please say if the action would make you more or less likely to vote for that candidate. A candidate who receives funding for their campaign from Super PACs funded by AI companies or their executives — IA: 74%, MI: 73%, OH: 73% A candidate who voted to cut billions in funding to Medicaid — IA: 71%, MI: 71%, OH: 73% A candidate who supports a nationwide abortion ban, without exceptions for rape, incest, or the life of the mother — IA: 64%, MI: 66%, OH: 66% A candidate who supports key parts of Trump's agenda, including helping Trump enrich himself off corrupt crypto schemes while in office — IA: 64%, MI: 66%, OH: 65% September 4–14, 2026 survey of 3,157 likely voters in IA, MI, and OH.

ALT Bar chart of polling data from Data For Progress. Title: Voters in Key States Believe AI Will Increase the Wealth of Billionaires, But Not American Workers. Description: How much do you agree or disagree with each of the following? — AI will increase the wealth of... Billionaires — Agree: 79%, Disagree: 8% American workers — Agree: 21%, Disagree: 64% Billionaires — Agree: 76%, Disagree: 10% American workers — Agree: 21%, Disagree: 62% Billionaires — Agree: 75%, Disagree: 10% American workers — Agree: 23%, Disagree: 61% September 4–14, 2026 survey of 3,157 likely voters in IA, MI, and OH.

ALT Bar chart of polling data from Data for Progress. Title: More Than Two-Thirds of Voters Believe the U.S. Should Have a Refugee Program. Question: A refugee is a person forced to leave their country to escape war, violence, or persecution due to factors such as race, religion, or political opinion. Should the government have a refugee program that helps bring some people seeking refuge to safety in the U.S.? Results (should have / don't know / should not have): All likely voters: 67% / 10% / 23%. Democrats: 78% / 7% / 15%. Independents/third party: 66% / 10% / 24%. Republicans: 55% / 13% / 32%. Know a refugee: 90% / 1% / 9%. Don't know a refugee: 66% / 10% / 25%. September 18–20, 2026 survey of 1,194 U.S. likely voters.

ALT Bar chart of polling data from Data For Progress. Title: A Majority of Likely Voters Oppose Deporting Immigrants to Countries Other Than Their Country of Origin. Description: Currently, the U.S. government is deporting thousands of immigrants – including people legally granted protection in the United States – to countries other than their country of origin, including countries they have never been to. For instance, the U.S. has deported an immigrant from Cuba to South Sudan and an Afghan asylum seeker to the Central African Republic. Do you support or oppose this practice? All likely voters — Support: 31%, Oppose: 60% Democrat — Support: 16%, Oppose: 76% Independent / Third party — Support: 30%, Oppose: 62% Republican — Support: 48%, Oppose: 41% Yes, I know someone who is a refugee — Support: 35%, Oppose: 62% No, I do not know someone who is a refugee — Support: 32%, Oppose: 60% September 18–20, 2026 survey of 1,194 U.S. likely voters.