

Empowering traders with Quant & AI skills. 📈
India
Joined October 2012
- Tweets19.2K
- Following1.7K
- Followers14.2K
- Likes2.8K




Pinned Tweet
1 nanosecond in HFT, stretched to 1 second, makes a blink of an eye last about 10 years.
Sameer Kumar (iRage), Stefan Jansen (@ml4trading), @G2GAjaySharma, Tony Lee (Alpaca) and Mridul Arora (Elevation Capital) at our Algo Trading Conference 2026 👇
#AlgoTrading #HFT #QuantTrading
Buying the S&P 500 at an all-time high has done about as well as buying on any day.
Since 1950, the next 12 months averaged +8.7% after a record close and +9.4% after any day.
Record days cluster, so the sample is smaller than it looks. History, not a forecast.

1
210
Momentum's 10 worst months since 1929: 9 came as the market bounced after a two-year fall.
Aug 1932 -53%. Apr 2009 -34%. Daniel and Moskowitz (2016) found this. It holds on Ken French data to Aug 2026. The beaten-down losers jump most, and momentum is short them.

3
1
454
The Fed's September hike was its first after a run of cuts. That has happened 6 times before since 1990.
A year later the S&P 500 was higher in 5 of 6. But the median gain was 5.2%, vs 11.8% for any 12 months since 1990.
Six cases is far too few to lean on.

3
331
"Buy when the VIX is above 30" looks great if you count days.
The VIX closed above 30 on 734 days since 1990. The S&P 500 was higher a year later after 87% of them.
But that's only 22 separate scares. Of the 21 with a full year, 14 were higher (67%). Any day: 81%.

2
2
378
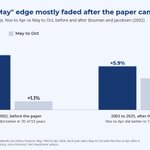
"Sell in May" mostly faded after the paper that made it famous.
Bouman and Jacobsen published the Halloween effect in 2002. S&P 500, 1950 to 2002: Nov to Apr beat May to Oct in 35 of 53 years. Since 2003: 12 of 23, a coin flip.
May to Oct still averaged +4.3% since 2003.

4
3
418
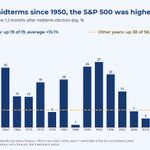
The S&P 500 was higher a year after every US midterm election since 1950. All 19 times, average gain 15.1%.
The same date in other years: up 38 of 56, average 7.3%.
19 cases is a small sample, and part of the gap is the Nov to Apr season. A base rate, not a forecast.

4
1
419
Python or C++ for a quant career? It depends which seat you want, and the answer is clearer than the arguments online.
Researcher: Python. pandas, NumPy, statsmodels, scikit-learn. How fast you can try ideas matters more than how fast they run.
Trader: Python for analysis, plus the desk's own tools. Mental maths matters more than either language.
Developer, low latency: C++. Memory, cache behaviour, networking, Linux. Here microseconds are the job.
Developer, research platform: Python plus one compiled language, and strong testing habits.
Risk: Python and SQL.
If you don't know your seat yet, start with Python. It's the shared language between research and everyone who uses it. Add C++ when a role asks for it.
1
6
955
What a new quant hire gets judged on in the first 90 days. It isn't alpha. Nobody expects that in month one.
What people watch for:
• Did you learn the data before you trusted it?
• Did you ask before assuming?
• Did you finish something small, end to end?
• Can you reproduce your own result when someone asks on day 40?
The fastest way to lose the room is a number you can't reproduce.
The second fastest is a model built on a column nobody told you was backfilled. Ask what every field means and when it lands.
Most first-quarter wins are unglamorous: a data check that caught a bad feed, a test someone else can rerun, a note that saved a colleague a week.
Send this to someone starting a quant job this year.
4
3
517
What does a quant earn in India? Anyone who gives you one number is guessing.
Published ranges put entry-level quant trader roles around ₹20 to 35 lakh, and quant developer roles starting near ₹14 lakh, with experienced seats quoted well above both.
The band is wide because three things move pay more than the title does:
• Firm type: bank, fund or prop desk
• Asset class, and the desk's own P&L
• How the variable part is decided
Two developers at one firm can sit in different bands, one priced against research and one against systems engineering.
So treat any figure as a reference point, not a rate card. Ask which track a seat sits in and how the bonus is set before reading anything into the number.
Published ranges and the caveats behind them: quantinsti.com/articles/quan… and quantinsti.com/articles/quan…
1
595
Five things that get quant CVs passed over, and the fix for each.
1. A Sharpe ratio with no test period.
Fix: state in-sample and out-of-sample, with costs.
2. "Built an LSTM to predict stock prices."
Fix: say what you predicted, against which baseline, and whether it beat it.
3. Every tool you've ever touched.
Fix: list only what you could be quizzed on for 20 minutes.
4. One CV aimed at every quant seat.
Fix: one version per seat.
5. Certificates in the top half.
Fix: projects first, certificates last.
The common thread: a reviewer wants evidence you know where your own result could be wrong.
Which of these was on your last CV?
3
2
517
A reviewer gives your quant GitHub about two minutes. They're rarely looking at the returns.
They're checking whether you handled the boring parts, because the boring parts are the job:
• Data source and date range stated
• Rules written down before the test
• Costs and slippage applied
• A test period you never touched while building
• A README that says what you'd do differently
Six projects that give a reviewer something to ask about:
1. Momentum on 50 stocks, run on today's index members and on point-in-time members
2. A pairs trade, plus the test that showed when the pair broke
3. A backtester that handles splits, dividends and missing days
4. An options P&L explained day by day through its Greeks
5. A limit order book simulator in C++ or Python
6. A cost study: how much edge a simple strategy needs to survive fees
Three finished projects beat nine certificates. And a failed backtest, written up properly, is often the best one to show.
2
528
What does a quant trader actually do all day?
The algos place the trades. The day goes on checks: positions vs the broker, every fill, a lookback tweak that failed out of sample, one strategy at 92% of its risk limit.
A simulated desk day in 54 seconds.
October has a reputation. 1929, 1987, 2008: the crashes people remember are October crashes.
We checked the S&P 500 since 1950, 921 months.
October does hold the two worst months on record: -21.8% in 1987 and -16.9% in 2008. It also has the most days with a fall of 3% or more: 20 of them.
But the average October gained 0.9%, and the index rose in 45 of 76 Octobers.
The month with the weak record is September. Average -0.6%, and the only month the S&P 500 fell more often than it rose: up in just 34 of 77 years.
So October is the month of big days, not bad months. One is a volatility problem and the other is a return problem, and they call for different questions about a portfolio.
Which month did you expect to be worst?
Data: S&P 500 price index via Yahoo Finance, Jan 1950 to Sep 2026, no dividends. History, not a forecast. Not advice.

Nifty has fallen 8 weeks in a row, its longest losing streak since 2001. Week 9 is still in the balance.
Oil is up 25% since early August. The US government's 10-year borrowing rate is the highest since 2007. The rupee is near its weakest ever, and on Wednesday the RBI raised rates for the first time since 2023. When every headline points the same way, selling starts to feel like the safe choice.
So we checked what that choice has usually cost.
All 10 of Nifty's best days since 2007 came when it was already 19% or more below its peak. Big up days tend to land right next to big down days (13 of the 20 best came within 10 trading days of one of the 20 worst), so whoever steps out to "wait for clarity" usually misses the rebound along with the fall.
In rupees: ₹1 lakh in Nifty in Sep 2007 grew to ₹4.97 lakh by Thursday. Miss the 10 best days and it was ₹2.36 lakh. (Price index only, dividends ignored.)
None of this means the fall is over. In 2008 a 15% drop kept going to nearly 60%. That's the case for rules over hope. Size positions so a 20% fall won't force you out. Decide your exit before the bad week, not during it.
Not investment advice.

1
2
460