







Ever frustrated by Tableau or PowerBI firing multiple queries (or choking in DirectQuery mode) just to compute a simple Running Percentage?
In Agile Query, advanced secondary metrics (Running totals, Running %, Percentiles) are compiled cleanly and pushed down in a SINGLE SQL query ⚡️
❌ No two-pass roundtrips to the DB
❌ No client-side memory blowups
✅ 100% warehouse pushdown with modern window functions
This is how real-time BI over data warehouses should feel.
🚀#ModernDataStack #BusinessIntelligence #SQL #DataEngineering

68
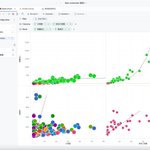
High density. Zero lag. ⚡Testing mass-mark interactive performance in Agile Query Desktop:
8×5 metric matrix × thousands of rendered bubbles × real-time tooltip tracking.
Built for analysts who refuse to wait for spinners.
#AgileQuery #DataViz #TechShowcase

1
1
69
Upgraded pivot tables in Agile Query Desktop 📊⚡
1️⃣ Hierarchical drill-downs (Month → City → Product)
2️⃣ In-cell visual data bars with custom palette presets
3️⃣ Smart scale calculation across hierarchy levels & subtotals
4️⃣ Multi-condition drag-and-drop filteringTurning dense spreadsheet data into glanceable insights.
#AgileQuery #BusinessIntelligence #Analytics #Productivity

3
57
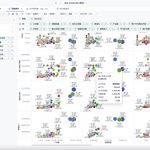
Say hello to fluid, multi-dimensional data exploration with Agile Query 📊✨Drag, drop, and slice through complex datasets in seconds:
🔹 Scatter plot matrix with small multiples
🔹 Rich visual encoding: size by AOV, color by sales volume
🔹 Clean, native desktop experience built for speedNo bloated BI overhead. Just your data, visualized effortlessly.
#DataViz #BusinessIntelligence #Analytics #AgileQuery #BuildInPublic

3
99

Did GLM 5.3 get a silent downgrade today? It went from frontier coding model to totally unusable overnight.
64
Meet Agile Query — modern data exploration made seamless & beautiful.
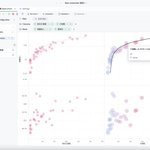
📊✨🔹 Multi-metric split views in a single pivot chart
🔹 Independent color marks & legends per measure
🔹 Clean, native desktop experienceComplex multi-dimensional analysis, zero friction.
🚀#AgileQuery #DataAnalytics #DataViz #BusinessIntelligence #SaaS

51


You can now create charts at different levels of granularity from the same query in pivot charts.

1
71


