

DNA tests | CPO in Genotek 🧬 | Human genetics | Population genetics
Joined October 2012
- Tweets380
- Following484
- Followers659
- Likes818





Pinned Tweet
🧬Machine learning prediction of hypertension integrating polygenic risk scores in 175,704 inner Eurasian individuals from Genotek biobank🧡
Today our paper in Frontiers in Cardiovascular Medicine was published. We analyzed three PRS for blood pressure traits. The strongest effect was observed for the diastolic blood pressure PRS, with an OR of 6.7 for the top decile compared with the bottom decile
We also showed significant associations across different ethnic groups, including Russians, Mordvins, Ashkenazi Jews, Buryats, Yakuts, Armenians and populations of the North Caucasus.
The best-performing model was a Dense Neural Network with ROC-AUC = 0.82. The model integrated questionnaire-based risk factors, including age, sex, BMI, smoking, alcohol consumption, education, work type, physical activity and daily steps, together with three polygenic risk scores.
Overall, we showed that a combined model based on questionnaire data and three PRS achieves good predictive performance and transfers across different ethnic groups of inner Eurasia.
This work grew out of the master’s thesis of our student Vera Tsvetkova.
frontiersin.org/journals/car…
#PRS #Hypertension #MachineLearning #AncestryComposition

Svante Pääbo and colleagues used AlphaGenome as a time machine to reconstruct the evolution of human gene regulation. An impressive new bioRxiv preprint! 🧬⏩
Fifty years ago, scientists proposed that the differences between humans and chimpanzees might be driven less by changes in genes themselves and more by changes in how those genes are regulated.
The authors revisited this hypothesis using deep learning and identified more than 71,000 genomic regions predicted to have gained regulatory activity along the human lineage. But the most interesting finding is how these changes happened!
In 71% of cases, evolution repurposed existing regulatory elements rather than creating new ones. A single mutation could introduce a tissue-specific transcription factor binding site, activating an existing element in another tissue.
To investigate this, the researchers used AlphaGenome to predict the regulatory effects of 17 million nucleotide substitutions, linking them to gene expression differences between humans and other great apes.
Interestingly, the vast majority of these regions fell outside known Human Accelerated Regions, genomic regions that evolved unusually rapidly along the human lineage. This suggests that the rate of sequence evolution does not necessarily reflect its functional impact.
Comparisons with Neanderthal and Denisovan genomes revealed that 99.6% of the regulatory gains fixed in modern humans and successfully dated arose before our evolutionary split from these archaic lineages.
There are also fascinating examples involving individual genes. One is SLC47A1, which encodes a transporter involved in eliminating drugs and toxins. The researchers identified five regulatory gains associated with increased expression in the human liver. Reverting these changes to their ancestral states in silico reduced predicted gene expression by 60%.
Of course, many of these predictions still require experimental validation. But the broader idea is remarkable: ancient DNA has allowed us to discover which mutations occurred in the past. Now, deep learning is beginning to reveal how those mutations may have changed the way genes worked.
biorxiv.org/content/10.64898…
#aDNA #evolution #regulation #AlphaGenome

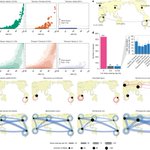
When our ancestors left Africa and spread across the world, they carried not only their genes but also thousands of microorganisms living in their gut. 🧬🦠
A new @Nature study explored whether the evolutionary history of gut bacteria follows human migrations.
Researchers compared the gut microbiomes of the Hadza hunter-gatherers from Tanzania and the Tsimane farmers and hunter-gatherers from Bolivia.
Surprisingly, 87% of microbial species were shared between these populations. Many of these bacteria are now extremely rare in industrialized societies, suggesting that we may be losing part of our ancient microbial heritage. Whether this affects our health remains unknown.
But the most fascinating result came from comparing bacterial genomes. Despite sharing the same species, their bacterial strains were genetically distinct.
Using bacterial recombination patterns and population genetic modeling, researchers estimated that these bacterial populations became isolated around 17,000 years ago. Remarkably, this roughly matches the period when humans first settled the Americas.
A beautiful example of how ancient human migrations left traces not only in our DNA but also in the genomes of bacteria living inside us.
nature.com/articles/s41586-0…
#microbiome #gut #evolution

Alexandr Rakitko retweeted

My group's paper out on the cover of Science!
Native Hawaiians are most closely related to the Rapanui of distant Easter Island 😮
Proud of it my students, the two co-first authors Cole Shanks & former MS student @edwardhuangc, and 3rd author @chrisoutho.
science.org/eprint/4HAYG3KTP…
East Asians often develop type 2 diabetes at a substantially lower BMI than Europeans. Does this mean that the genetic architecture of the disease is different? 🧬
A recent @CommsBio study addressed this question using a GWAS of almost 600,000 people of East Asian ancestry and a European GWAS of comparable statistical power.
Surprisingly, the overall picture was very similar. The studies identified 196 loci in East Asians and 199 in Europeans. Fine-mapping identified 521 likely causal signals, and about 74% were shared between the two populations.
But differences emerged when the authors looked deeper into the biology. Type 2 diabetes develops mainly through two related mechanisms: insufficient insulin secretion by pancreatic β cells and insulin resistance, strongly influenced by adipose tissue, lipid metabolism and obesity.
In both populations, GWAS signals were strongly enriched in regulatory regions active in pancreatic β cells. Yet the regulatory architecture differed: HNF1B-related regions were more enriched in East Asians, while PDX1-related regions were more prominent in Europeans. Europeans also showed a stronger genetic component related to adipose tissue and lipid metabolism.
The authors then used previously developed polygenic scores representing insulin secretion and insulin resistance. Among controls, the scores were almost identical between Japanese and British participants. But among people with diabetes, both effects were stronger in Europeans: OR 1.40 vs 1.21 for insulin secretion and OR 1.35 vs 1.18 for insulin resistance.
This raises an interesting question. Do East Asians have a lower threshold for developing diabetes, requiring less polygenic burden? Or do these mechanistic PRS simply work better in Europeans?
Still, PRS performed quite well in an independent Taiwanese cohort: a model combining age, sex, genetic PCs and PRS reached AUC ~0.8.
Overall, this looks like the same polygenic system with somewhat different weights assigned to its components across populations.
nature.com/articles/s42003-0…
#T2D #GWAS #PRS

Incredible but for more than 100 years we may have misunderstood the origin of the most common primary intracranial tumor. 🤯 🧠 🧬
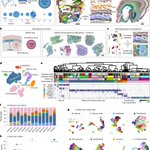
A new study in @NatureCellBio Biology uses single cell RNA sequencing and spatial transcriptomics to challenge the classic view of meningioma.
Meningioma is not rare. It accounts for more than 40% of primary brain and CNS tumors. In some MRI studies almost 1 in 50 people around age 70 had an asymptomatic meningioma. The brain is covered by three layers. Pia mater, arachnoid mater and the outer dura mater. Meningiomas grow from these coverings at the surface of the brain.
For more than a century they were thought to come from arachnoid cap cells. The reason was largely morphological. These cells simply looked very similar to meningioma cells.
The authors built a cell atlas of the developing human meninges using more than 150,000 single cell profiles together with spatial transcriptomics. The result was striking.
Meningioma cells did not look especially arachnoid-like. They were much more similar to cells of the dura and particularly the inner dura.
There was another elegant clue. The authors looked at 20 genes most often mutated in meningioma and asked where these genes are normally expressed. Again the strongest signal came from dural cells.
This does not yet prove that meningiomas originate from the dura. Tumor cells could acquire a dura-like state later.
But if this is confirmed it would mean that for more than a century we may have been looking at the wrong normal cell when trying to understand one of the most common brain tumors.
And this matters. For meningiomas that cannot be controlled by surgery or radiation there is still no highly effective drug treatment. Finding the true cell of origin could change where we look for therapeutic targets.
nature.com/articles/s41556-0…
#scRNA #spatialTranscriptomics #meningioma

Alexandr Rakitko retweeted

New preprint led by @dmitrij22981 & @ivan_molotkov_ :
Genetic data improves prediction beyond clinical history in 96/150 diseases in @uk_biobank & @FinnGen_FI and is most valuable for people at low clinical risk
Preprint: shorturl.at/AEYQw
Models: shorturl.at/Dfla0🧵

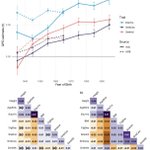
A new paper on assortative mating came out today and as far as I can tell it is the first direct analysis of this kind in All of Us cohort. 🧬👰🏻♀️🤵🏻♂️
Assortative mating means that partner choice is not completely random. People often pair with others who are similar in education, height, lifestyle and other traits. If these traits are partly heritable this can also leave a genetic signal.
Gretchen R. B. Saunders used several approaches in UK Biobank and All of Us. The most interesting one compares polygenic scores built from even and odd chromosomes. With random mating these scores should be nearly independent. But repeated assortative mating creates correlations between trait related alleles across chromosomes. This is gametic phase disequilibrium.
The strongest signals were for education at about 0.07, height at 0.04 and smoking initiation at 0.03 to 0.04. The estimates were very similar in UK Biobank and All of Us.
The main result is about change over time. In All of Us assortative mating became stronger in younger cohorts for education, smoking initiation and smoking cessation. For education the signal increased from about 0.04 in the 1930s to about 0.09 around 2000.
This is especially interesting next to the recent work of Robin Hofmeister and colleagues. Height is a nice example. In the Estonian Biobank Hofmeister found that genetic assortment for height increased from about 0.016 in older cohorts to 0.041 in younger cohorts. For education it increased from 0.016 to 0.036. [Scales are different!]
Their inter chromosome phasing approach is much more sensitive to the most recent parental generation. The even odd chromosome method used here instead captures a more long term accumulated signal.
So this paper is technically simpler but gives a useful independent view. And the All of Us results are especially interesting because they may reflect a distinct recent US pattern in education and smoking.
link.springer.com/article/10…
@AllofUsResearch #PRS #education #AssortativeMating #UKBiobank

Almost every paper on polygenic risk scores now reminds us that PRS should be adapted to ancestry. A new @NatureGenet study suggests another important dimension. Age.
The authors studied BMI in 62,276 children across 11 age points from 6 weeks to 8 years. They identified 624 independent signals in the longitudinal analysis. Almost one third did not show the same effect in adults! For 165 signals the association disappeared and for 29 the effect reversed direction.
A striking example is PCSK1. One variant increased BMI at around 8 months but was associated with lower BMI in adults. This fits its biology well because PCSK1 processes multiple hormones and neuropeptides and its role changes across development.
The same pattern was seen with polygenic scores. At 8 to 12 months an age-matched genome-wide PGS explained 10.9% of BMI variance. A PGS trained on adult BMI explained only 1.3%. More than an eightfold difference.
The underlying biology was familiar. The leptin melanocortin pathway was strongly enriched but different genes had different temporal profiles. LEPR and PCSK1 were more important early in life while MC4R POMC and BDNF showed more persistent effects.
Signals were also found near GLP1R and GIPR. Some GLP1R variants acted mainly in early childhood. This is especially interesting because GLP1R is the receptor targeted by semaglutide in Ozempic.
Similar results were seen for rare variants in nearly 480,000 genomes. The authors also found parent-of-origin effects. For example KLF14 acted mainly when the allele was inherited from the mother which fits its known imprinting.
To me, this makes it clear that PRS may need to be adapted not only to ancestry but also to age. The difference can be dramatic. In infancy the right age-specific score explained more BMI variation than score trained in adults. The genome stays the same. Its effects do not.
nature.com/articles/s41588-0…
#GWAS #PRS #adiposity #BMI #snRNA

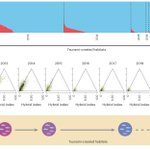
Usually, we only see the outcome of natural selection after hundreds or thousands of years. In a new @NatureEcoEvo study, researchers were able to watch it almost in real time. They even know the date of the event that set it in motion: March 11, 2011, the day of the devastating Tohoku tsunami in Japan. 🌊🦈 🧬 🇯🇵
The tsunami created new freshwater ponds and brought together two stickleback species, one adapted to freshwater and the other to marine life. Just one year later, 38% of sampled fish were hybrids. But within about ten generations, almost all marine ancestry had disappeared from the population.
The process happened in layers. Marine alleles disappeared especially fast around loci involved in hybrid male sterility, freshwater adaptation, migration and reproductive isolation. Selection first removed some of the strongest barriers and then continued across much of the genome.
And some marine alleles may have literally swum out of the population. Fish carrying marine ancestry were more likely to migrate toward the sea and leave the freshwater habitat. So ancestry could disappear not only because its carriers survived less well, but also because they simply left.
Even after the strongest loci were removed, marine ancestry continued to decline. Simulations showed that genetic drift alone was not enough to explain this. One possible explanation is hundreds or thousands of weak Dobzhansky–Muller incompatibilities spread across the genome.
But not every marine region disappeared. A few survived and some may even have been beneficial, although the evidence for adaptive introgression is still limited. Similar patterns were also found in other populations created by the tsunami.
So tsunami first broke the barrier between two species and triggered massive hybridization. The genome removed this admixture layer by layer. It is a remarkable example of how even after strong hybridization, natural selection can push genomes back toward established species boundaries in just a few generations!
nature.com/articles/s41559-0…
#selection #hybridization #tsunami #adaptation

GWAS have identified many genetic variants linked to adult facial features. But we still face a major interpretation problem because there is a black box between a genetic variant and the actual shape of the nose, jaw or other parts of the face. 🧬👃🏻👂🏻
A new @NatureGenet study tries to open this box. The authors studied human facial development from about week 6 to week 11 and combined RNA-seq, ATAC-seq, spatial transcriptomics and micro-CT. This shows which genes are active, which regulatory regions are open, where this happens and at what stage of development.
For some GWAS variants, they could now reconstruct the path from variant to phenotype. A variant sits in an enhancer that becomes active in a specific cell type, place and developmental window. This changes the activity of a nearby developmental gene and can ultimately affect a specific facial feature.
PAX1 is a nice example. Breaking the whole gene causes severe defects. But enhancers provide much finer control by tuning the same gene only in the right tissue and at the right time. Disrupting one such enhancer in mice changed skull shape without producing the full PAX1 knockout phenotype.
The most surprising result is about nerves. They may not simply connect to an already formed face. Peripheral nerves seem to help fine tune the shape of the facial skeleton during development.
This is the real power of multimodal studies. A GWAS SNP alone is just an association. But when genetics, chromatin, gene expression, spatial information and anatomy are seen together, the path from DNA to a visible human trait starts to become clear.
nature.com/articles/s41588-0…
#GWAS #Multiomics #scRNA #face

Alexandr Rakitko retweeted

Introducing #scDRS-FM for #finemapping #polygenic disease associations across individual cells in #scRNAseq!
✅Distinguishes disease associations among closely related cell populations
✅Substantially higher power than #scDRS
medrxiv.org/content/10.64898…
Alexandr Rakitko retweeted

🚀 We’re hiring PhD students to join my group at Human Technopole!
Work on AI, foundation models, LLMs, EHRs, human genetics, and population-scale health data.
PhD via Politecnico di Milano.
Apply 28 Jul–7 Sep 2026.
Details: lnkd.in/dAwK4Gka
Alexandr Rakitko retweeted

excited to share our new review on robust microbiome–aging research - with some personal context on why we wrote it 👇 (1/10) febs.onlinelibrary.wiley.com…

Alexandr Rakitko retweeted
Now out at @NatureComms - nature.com/articles/s41467-0….
Explore the performance of polygenic risk scores, thousands of PGS-disease associations, multi-PGS models, reference distributions for PGS, and access personalized predictive models for time-to-onset for key chronic diseases at pgs.nchigm.org


In our new study we evaluated 3,000+ polygenic risk scores in nearly 500,000 @FinnGen participants. See PGS performance metric, multi-PGS models, PGS-PheWAS and personalized predictive models within #PGSBrowser: pgs.nchigm.org and the preprint at tinyurl.com/yjt24kht
New @NatureHumBehav study presents the first large GWAS of infant and toddler temperament in up to 72,663 children. The authors analyzed parent-rated emotionality, activity, shyness and sociability in the second and third years of life and found SNP heritability of 6.79%, 9.55%, 15.26% and 3.42%. They identified 10 genome-wide significant lociand found genetic links with later traits including ADHD, autism, neuroticism and extraversion. The best PGS explained only 1.9% of variance for shyness, so prediction remains modest.
nature.com/articles/s41562-0…
#GWAS #temperament

🧬By age 70 mosaic loss of chromosome Y can be detected in up to around 40% of men. Sequencing data can now estimate not only whether mLOY is present, but also what fraction of blood cells have lost the Y chromosome, making it a promising quantitative marker of aging.👴
In a new bioRxiv preprint the authors present BaySeq-Y -- a Bayesian method for direct estimation of mLOY from sequencing VCF files. The approach is elegant because it combines two complementary signals.
First, cells with Y loss should show reduced read depth in the male specific non-PAR region of chromosome Y.
Second, pseudoautosomal regions are shared between X and Y. If a man is heterozygous in PAR, loss of the Y copy creates allelic imbalance. BaySeq-Y can use this imbalance in the final estimate. With phased data it can also use haplotype specific information from PAR1.
Simulations show that these signals work better together than separately. Y-non-PAR depth is informative at low mLOY levels, while PAR allelic imbalance becomes especially useful at higher mLOY levels. With phased PAR1 data the method remains accurate across a broad range of mLOY fractions.
BaySeq-Y also performed well compared with mLRR-Y, MosCoverY and MoChA, especially under sequencing bias and imperfect phasing.
A nice part of the study is validation with FISH. The sample size is small, but the estimates were close to experimentally measured fractions of cells with Y loss.
Even more interesting is the expression analysis. In ROSMAP and GTEx, higher predicted mLOY was associated with lower expression of Y-linked genes. This supports the idea that quantitative mLOY estimates capture a real biological signal, not only a technical sequencing pattern.
biorxiv.org/content/10.64898…
#Ychromosome #aging #NGS #BayesianInference #mLOY

🧬Before using polygenic risk scores in your research take a look at the new @NatureCommunications paper introducing PGS Browser.✍️
The authors benchmarked 3,168 PRS models across 4,739 clinical traits. Here are just a few ways to use the resource:
- choose the best PRS for your disease;
- estimate how much a specific PRS increases disease risk;
- discover what other diseases are genetically associated with a PRS;
- identify non target PRS that can improve prediction models;
- compare different PRS and see how similar they are.
The paper also reports several interesting findings.
Two PRS with nearly identical performance may classify very different people as high risk. For hypertension two models had AUCs of 0.60 and 0.59 but only 30% overlap among individuals in the top 2.5% of the risk distribution.
Combining several PRS improved prediction for most diseases and consistently outperformed a single PRS.
The best performance was observed for immune related diseases including coeliac disease and ankylosing spondylitis.
Only 3.8% of all evaluated PRS achieved AUC above 0.7 ((
Congratulations to @nikart89 and colleagues on an impressive resource!
pgs.nchigm.org
nature.com/articles/s41467-0…
#FinnGen #PRS #PGSBrowser #PolygenicScores

🧬Possibly one of the most important genetics preprints of 2026 has just been published: the flagship paper of the Vertebrate Genomes Project.
An ambitious effort to generate near-complete and near-error-free reference genomes for all living vertebrate species.
The authors present 816 high-quality reference genomes covering around 95% of major vertebrate evolutionary lineages. Most assemblies are at chromosome-level quality and some are fully diploid telomere-to-telomere genomes.
Using this resource the authors reconstructed the genome of the last common ancestor of vertebrates, studied the evolution of sex chromosomes, explored 3D genome organization and compared epigenetic landscapes across hundreds of species.
This dataset will likely become a foundational platform for evolutionary biology and comparative genomics.
biorxiv.org/content/10.64898…
#VGP #evolution #ComparativeGenomics #vertebrates #genomes

🧬The largest collection of newly generated genetic data from late Neanderthals was published in @Nature.
Some of the most interesting findings:
- No evidence of recent close inbreeding
- No signs of recent gene flow from Homo sapiens
- No increase in genetic load
- The analysed remains from Goyet were not from a single family group
- Neanderthals from Belgium and nearby France formed a distinct regional population different from other known Neanderthal groups
One genome was sequenced at high coverage becoming only the fifth high quality Neanderthal genome available today.
nature.com/articles/s41586-0…
#Neanderthals #aDNA #inbreeding #mtDNA
