

Fundamentals. Finally, clear.
Joined February 2026
- Tweets197
- Following30
- Followers919
- Likes81


The ultimate play that wins regardless of what $NVDA reports: $AVGO 🚨
Down -30% from highs.
✅ It's an Asymmetric Setup
• If $NVDA beats + guides strong:
AI cluster density surgers + drives demand for $AVGO networking.
• If customers diversify away from $NVDA:
Hyperscaler CapEx flows to $AVGO custom XPUs.
✅ It's a Cash Machine
Q3:
🔸 Revenue: $29.6B (+86% YoY)
🔸 EPS: $3.32 (+96% YoY)
🔸 Op Margin: 68%
🔸 Q4 Guide: $34.8B Revenue
✅ It's Roster: $GOOGL, $META, Anthropic, OpenAI
⚠️ The Risk: Orders will slow if Congress slows permitting or hyperscalers cut budgets.


The 1 thing that matters this week:
the companies most affected by $NVDA earnings. 🚨
🟢 Stands to gain:
If uncertainty or hyperscaler diversification accelerates, capital will rotate:
1️⃣ $GOOGL 19x Forward P/E
• TPUs are showing to be excellent competitor
2️⃣ $AVGO 17x Forward P/E
• 3-engine cash machine: AI networking, custom chips & software. Wins either way.
🔴 The most exposed:
Debt-heavy neoclouds dependent on circular financing.
1️⃣ $CRWV 16x Debt-to-Equity
• Massive $132.5B backlog, $846M in quarterly net interest expense already exceeds operating profit.
2️⃣ $NBIS 0.9x Debt-to-Equity
• $40B - $45B FY27 CapEx guide is 3.4x projected Revenue.


3
553
$NBIS is 57% below its $299.86 high.
Trading at about 2.5x the midpoint of its '27 revenue guide.
The multiple is cheap if they deliver on time.

5
448


$COST issuing a MASSIVE $30/share cash dividend.
The largest special payout in company history 🤯
And it's not the first time:
Dec 2012: $7 /share
Feb 2015: $5 /share
May 2017: $7 /share
Nov 2020: $10 /share
Jan 2024: $15 /share
Nov 2026: $30 /share
While still aggressively putting tariff refunds back into lowering prices for consumers. 🙌


$CRWV Q3 numbers hit 👇
✅ Revenue: $3.66B ($3.54B consensus)
✅ Adj. Operating Income: $379M ($200M-$260M guide)
✅ Backlog: $132.5B (+138% YoY)
✅ FY26 Revenue Guide Raised to $13B - $13.3B
🔴 Net Interest Expense: $846M (swallowed all operating profit)
🔴 GAAP Net Loss: -$709M
🔴 Q4 Interest Guide: Climbing more to $1.05B - $1.15B
Buildout funding:
• $4.2B in new convertible senior notes
• Expecting $9B in customer prepayments & deposits in Q4
• Plans to sell up to 35M shares
💡 Majority of Texas power is already fully online or permitted & under construction.
❗️Management sees ZERO delivery impact to data centers hosting its $132.5B backlog.


1
3
349
$CRWV Backlog: $129B. Interest bill: 4x Operating Income.
If you own it, here's what to listen for 🚨
🔹 Can It Afford Its Debt?
• Q3 interest expense guided $860M–$940M
• Q3 operating income guided $200M–$260M
🔹 The Texas Problem
• Parts already permitted can likely still be finished.
Issuance of new permits is the threat.
How much of its pipeline is already permitted?
🔹 Is Backlog turning into Revenue?
• Q3 revenue guide $3.45B–$3.60B (Street: $3.54B)
🔹 Spending vs. Earning
• Q3 Capex guide $11.5B–$13.5B
• $3.50 spent for every $1 of revenue
When will spending peak?


1
437
$CEG hit -29% from its highs last week.
Then earnings shattered expectations👇
🔸 Revenue: $9.55B (+45% YoY, $9.21B expected)
🔸 Adj. EPS: $5.06 vs $3.04 (+66% YoY)
🔸 FY26 Adj. EPS Guidance: Raised to $12.50 - $12.80 (Consensus was $12.17)
and Big Tech kept signing: ✍️
🔹 $GOOGL 20-yr deal
🔹 $AMZN 20-yr deal
🔹 U.S. DOE: Conditional loan commitment for up to $5B to fund fleet-wide nuclear uprates.


2
457
“I should have bought $NVDA.”
Even though right now it's still a ridiculously cheap valuation:
Forward P/E: 20x
CAGR Revenue 3y: 100%
ROIC: 60%
ROE: 110%
Debt to Equity: 0.17
Can’t pass up these opportunities, even if there’s a chance for lower.


3
544
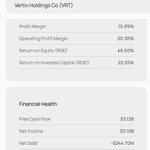
$VRT fell -25% on what MIGHT happen with data center rules.
Here’s what DID happen:
🔸 ROIC: 22.5%
🔸 CAGR Revenue 5yr: 18.5%
🔸 Forward P/E: 18.5x
🔸 Debt to Equity: 0.6
🔹 Revenue & Gross Profit: All time highs


1
5
564


$IREN down -44% since its last report
🚨 What earnings need to show:
🔹 Contracted vs. Operating Gap
• $4B total contracted ARR for 2026 capacity.
• $1B ARR is currently operating.
• What is the timeline for closing this $3B gap?
🔹 Revenue Trajectory
• Street consensus $220M – $230M
• Can they hit expectations with the current capacity?
🔹 $MSFT Contract
• Horizon 1 successfully handed over in August.
• Satellites shows Horizons 2, 3 & 4 have delays.
• Will they will hit the 2027 grace period deadlines?
🔹 Balance Sheet & Dilution
• $5.9B in cash, $2.8B GPU financing covers 90% of equipment costs.
• What are updates on the equity program for remaining costs?


1
500


$ARM beat earnings but there's still a problem.
Royalties, the core business, missed by $50M.
🔹 Royalty growth: 22% → 8%
🔹 Free cash flow: $411M → $110M
🔹 Operating cash flow: $567M → $207M
🔹 84% of the revenue increase came from licensing.
$ARM blamed memory prices squeezing smartphone volumes.
Down -59% from highs and still one of the most expensive chip stocks on earnings.


5
482
$APP hit a 52-week low pre this MONSTER print.
Guidance beat by +$100M,
the biggest sequential dollar jump in company history.
Nice +25% pop after-hours.


4
371
$UBER ride demand is ahead of driver supply,
which is why Mobility missed.
It plans to add 700 driverless cars by year end,
plus more than 2,000 in '27 and tens of thousands by 2030.
Up to $10B invested:
- $7.5B for its own fleet
- $2.5B in self-driving companies
Uber is shifting from capital light to owning vehicles.


4
432
$SMCI Revenue quadrupled to $19.9B
ONE customer accounted for 44% of it.
✅ Revenue: $19.95B (est. $17.53B) | +298% YoY
✅ EPS: $1.81 ($1.23 expected)
✅ Gross Margin: 12.8% (12% - 12.5% guide)
✅ FY27 Revenue Guide Raised: $72B - $82B
(from $65B–$72B)
❌ Operating Margin: 10.9% (from 14.3%)
❌ Free Cash Flow: -$481M


4
448
64% of $AMD revenue is from data centers.
Gaming is 5.8%.
✅ Revenue: $13.38B +45% YoY
✅ Operating income: $2.83B, +123% YoY
Q4 Guide:
Revenue: $17B
Gross margin: 55%


2
333