

An #OpenAccess @cdnsciencepub journal reporting peer-reviewed research from all areas of science and engineering related to northern Polar Regions.
- Tweets4K
- Following431
- Followers2.7K
- Likes3.5K





ALT Social card promoting journal scope for Arctic Science.

ALT Close-up of an Arctic fox against a pale blue sky, promoting a call for papers on climate change and Arctic fox research.

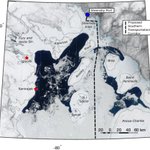
ALT Fig. 19. Sea ice in Northwestern Foxe Basin on 16 May 2019 as viewed by Moderate Resolution Imaging Spectroradiometer. The dashed line shows the proposed Southern Transportation Corridor (Baffinland 2024).

ALT Three skiers ascending a snowy mountain slope under a clear blue sky with Arctic Science branding and a call for perspectives submissions.

ALT Fig. 3. A summary illustration of potential factors influencing phage abundance (PA) in Arctic coastal marine systems in summer season: (A) ice meltwater inflow contributing to high PA; (B) VA released from lysed bacteria cells; (C) enhanced sunlight exposure causing higher phage decay; (D) adsorption of PA to sediment leading to PA loss.

ALT Logos of Canadian Science Publishing and Canadian Society of Zoologists with text highlighting their partnership.


ALT Announcement of a new tri-agency open access policy for research sharing starting January 1, 2027.

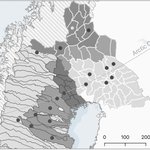
ALT Fig. 1. The reindeer husbandry area in Fennoscandia, showing the reindeer herding districts in Sweden and Finland. Herding districts included in the study are marked with a black dot. In Sweden, herding districts are divided into mountain (with summer ranges in the mountains and winter ranges in the forest), forest, and concession herding districts, the latter solely situated in the forest region. In Finland, the reindeer husbandry area is divided into the Sámi home area in the north, the central area (specially intended for reindeer husbandry), and a southern (“other”) reindeer management area. The Sámi home area is officially part of the area specially intended for reindeer husbandry (central). The map is displayed in North Pole Lambert Azimuthal Equal Area projection (ESRI:102017, WGS 84). Sources: Hydrography retrieved from Lantmäteriet (2023). Country boundaries retrieved from Esri World Countries map data (2022).

ALT Three skiers ascending a snowy mountain slope under a clear blue sky with Arctic Science branding and a call for perspectives submissions.

ALT Close-up of an Arctic fox against a pale blue sky, promoting a call for papers on climate change and Arctic fox research.

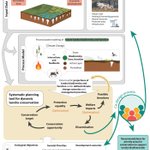
ALT Fig. 3. This framework supports the planning of protected area networks by integrating climate and ecological projections with anthropogenic demands. The final output identifies priority conservation areas. The entire process is co-designed with stakeholders, Indigenous peoples, and policymakers, who contribute data, define goals, refine outputs, and recommend collaborative protection strategies. Image by Ansgar Walk (Inuksugalait) and Giles Laurent (Reindeers), licensed under CC BY-SA 2.5.

ALT Three skiers ascending a snowy mountain slope under a clear blue sky with Arctic Science branding and a call for perspectives submissions.

ALT Announcement of a new collaboration between Canadian Science Publishing and the Canadian Black Scientists Network on a red background.

ALT Close-up of an Arctic fox against a pale blue sky, promoting a call for papers on climate change and Arctic fox research.

ALT Three skiers ascending a snowy mountain slope under a clear blue sky with Arctic Science branding and a call for perspectives submissions.

ALT Three skiers ascending a snowy mountain slope under a clear blue sky with Arctic Science branding and a call for perspectives submissions.

ALT Fig. 3. Example cases of identifying coastal submergence and coastal erosion processes, observed across different tidal states at the time of the 2020 Pléiades satellite imagery (1950–2020). Base map: Orthorectified NAPL aerial photography © NRCan (left) and 2020 Pléiades satellite imagery: PLEIADES © CNES, 2020, distribution Airbus DS (right).

ALT Fig. 1. Map of Greenland (Kalaallit Nunaat). Basemap: Natural Earth Quick Start (naturalearthdata.com). Boundary Data: NunaGIS/Asiaq (https://kort.nunagis.gl). Projection: WGS 84/Greenland Polar Stereographic (EPSG:5938).

ALT Stunning capture of a powerful lightning storm over Ephangweni, KwaZulu-Natal, South Africa.

ALT Close-up of an Arctic fox against a pale blue sky, promoting a call for papers on climate change and Arctic fox research.

ALT Workshop workflow and outcomes—Panel 1: Motivation and visioning. After introducing the motivation for visioning desirable futures for Arctic biodiversity (left), we set the scene with three “biodiversity stories” (bottom-right) and used an imaginary phone call made in the future to develop our individual visions (top-right). Artwork by Oliver Prothero.