

Chief Technical Strategist at https://teapawt.net/t.co/43CM3SVWCa, Trader-Investor and Belgian bier taster. No advice here, just information.
Mechelen, Belgium
Joined October 2008
- Tweets3.3K
- Following385
- Followers12K
- Likes1.3K



HEADS UP: I’ll be live on The Morning Show on @stockmkttv with @allstarcharts and @sstrazza TODAY at 9:00 am ET. Watch it here: stockmarkettv.com/morning-sh…


Back from hiatus and analyzing the big breakout in $TAN. Trend Comp turned bullish before the breakout, volatility is well above average and the ATR Trailing Stop is 15% below current levels. Bullish chart, but could be a wild ride. https://teapawt.net/t.co/fq8TtnFI0o

In today's video: The value of charts without annotations, zooming out and in on the setups in $SPY and viewing the inverse head-and-shoulders pattern in $QQQ with suspicion. youtu.be/RN41UozdZEI
The swings in Palladium $PALL are huge, but the overall trend is up and a classic setup is emerging. ETF fell back to prior resistance breaks and retraced around 2/3 of prior advance. Details in this post: trendinvestorpro.com/free/
SPY surged over 10% in 11 days for a bullish price thrust. Today's video looks at some prior price thrusts of similar magnitude. We also dive into candlesticks, the Trend Composite signal and the wild ride in palladium. $SPY $SPX $PALL youtu.be/SeteTGcQ2Vw

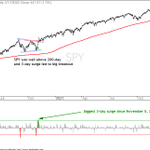
The 3-day 5.77% surge in $SPY was the biggest 3-day surge since the 6.07% surge on November 5, 2020. SPY was above the 200-day at the time and this surge led to a big breakout. SPY is currently below its 200-day and short of a breakout. #needfollowthru $SPX

This week's video quantifies recent volatility by measuring and comparing the high-low range percent for the $SPY, the DB Energy ETF $DBE and $GLD. An increase in volatility accompanied the trend reversal in SPY, and the parabolic moves in DBE and GLD. youtu.be/YjKbIH6EzHY
5

