20+ year student of the mkt. Swing trading breakouts from higher lows and tightening ranges on the highest ADR, highest momentum stocks. KK/KQ is the GOAT.
Aberdeen, MD
Joined June 2021
- Tweets8.8K
- Following45
- Followers35.2K
- Likes8K



Your trading account is the result of your last thousand decisions. Every entry, exit, risk taken, and rule followed or broken is reflected in your results. Your trading performance isn’t a mystery. It’s a receipt for your decisions.
AsymTrading retweeted

Not all Follow Through Days=FTD are equally actionable. FTDs must be graded on the action in and quantity of new leaders. I would grade todays likely FTD a C. If, if, if more quality new True Market Leaders erupt higher, I will upgrade my rating but for now today looks mostly like a short covering rally vs the start of something big. Dozens of todays big % movers like SNDK remain -40% to -65% off highs and even after todays large % gains remain below their 200DSMA. Hopefully in the next few days market health will improve. RoppelReport.com for all my best ideas.
#StockMarket #CANSLIM #BTC #Finance
RoppelReport.com If you haven't read the recent report, you're missing out.
#IBDPartner @marketsurge
get.investors.com/marketsurg…

AsymTrading retweeted

Today marked Day 3 of the latest rally attempts in both the Nasdaq and S&P 500. The earliest a follow-through day could occur is tomorrow. Ideally, one develops between Days 4 and 7, although valid follow-through days can occur later.
No bull market or major uptrend has ever begun without a preceding follow-through day. However, a follow-through day alone does not guarantee a sustained advance. The real test is the quality and breadth of leadership. A healthy uptrend requires several groups of institutional-quality growth stocks, preferably early in their cycles, to lead the way.
Despite the poor technical condition of the major indexes, a surprising number of sound setups are progressing across traditional growth sectors. However, these isolated pockets of strength should not be mistaken for healthy market leadership. With just 145 new highs versus 325 new lows today, most stocks are not participating.
The disconnect is unmistakable: select growth stocks are showing promise, but the broader market continues to deteriorate. Until participation broadens meaningfully, the foundation for a sustainable advance simply isn't there.
I remain 100% in cash. A follow-through day accompanied by broadening, healthy leadership would warrant a change in stance. Until then, I'll let the market earn my participation and keep following my rules. As Bill O’Neil famously said, “The market doesn't care what you think or how you feel, which is why you have to have rules!”
Stay patient, refine your watchlists, update your alerts, and be ready when conditions improve.


AsymTrading retweeted

Here is how to use AI to build a database of YOUR system/setup for the past 50+ years.
This is probably the MOST important, rewarding, and hard work you will ever do as a trader.
I personally did so to:
• manually gather 13k+ signals of my breakout system
• since 1995
• covering ALL market cycles possible
Why do this?
Easy. You will have the deepest understanding of your setup and most importantly how it works in ALL market phases.
You will not just get an idea of how well it in 2025 to later fail in 2026, and instead of getting fearful and changing things based on emotions, you will have a NORMAL DISTRIBUTION of your setup to work for.
How to do it?
The correct way here is not as most do, going back in the charts and pointing at successful trades and building a book or something.
Here you will practice/develop your PROCESS.
You will ask AI to build a time machine for you
Based on your scans, you will create a reviewer station software that shows every day your scans, and you MANUALLY review them, to later build a database and model a portfolio not on stocks that looked good, but those that made you click and buy based on your RULES.
So it's no longer a backtest, but FORWARD WALK EVIDENCE.
BIg difference.
What you need?
-> a Codex or Claude Code Sub
-> quality historical data
-> willingness to do the work
Here are the steps I used to build my signal gallery, including my SPX Signal Map back to 1995 with all my breadth indicators and context paired with ALL my signals.
1) First, you need to set up AI and Premium data. I used a mix of CODEX and CC (either is fine, models are quite smart nowadays). For data, I used Norgate, as they include delisted stocks all the way back to 1950 (20k total stocks)
2) Create the project folder, and prompt AI to build a reviewer time machine based on your scanning. You want to feed your scans and explain your process, so AI can rebuild what you would see on a Tuesday in 1961 based on your criteria, just like you were there with your computer. you can also prompt to build a portfolio simulator so when you decide to take a trade, you size, place the stop, and margin starts getting recorded
3) Once you do this, here comes the hard work. Go through day by day, every day for as long as data permits. You will have over 10k trades logged in easily, you can also skip the section on the portfolio simulation and just gather trades YOU would take, and run the portfolio sim on the side with margin restrictions, position sizing, etc.
4) I went through 400k charts manually myself, and the KEY here is that you take trades as your RULES AND PROCESS allow you to. Whatever your process is, it gets recorded. No hindsight, no nothing
5) At the same time, you will notice many things...
- when markets are in heavy downtrends, you will notice sometimes many weeks go by and there are no trades if you go mostly long.
- You will see that signals/trades look the SAME most of the time, they look great, but depending on what the market is doing, they follow through like night and day
- You will start getting an understanding of the MARKET PHASE AND CYCLE to another level
6) after all the work, AI will build a database for you, and here is when things start to get cool. You can do SO MUCH with this info. This is something nobody can replicate, as this is a database built on YOUR trading, YOUR process.
7) I built a signal gallery myself, an interactive real-time simulator for each signal for practice and visualization, and an SPX signal map with every single trade overlay on a SPX or NAS chart to see visually how everything does within the cycles.
This kind of work is done by those who want it bad enough.
Remember, you only have to do it once 📈
The market continues to be rotational. While healthcare still looks solid under the surface, Defensives, Consumers, RE, and Financials are softening under the surface, while the bottom of the pile (Tech, Material, Industrials) is firming up. Energy is a lost cause lol.

I originally posted this article to highlight Mark Boucher’s strategy for identifying runaway markets, but at their core, the TBBLBG patterns are simply a way to recognize aggressive buying and accumulation. Whether it’s a Thrust Breakout, Breakaway Lap, or Breakaway Gap, these patterns reflect strong buying pressure driving a stock higher. The underlying concept is straightforward: identify stocks attracting aggressive buying, often before a sustained move becomes obvious.


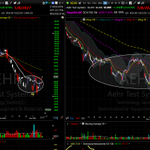
$AEHR holding this gap nicely after clearing a few pivots. Structurally one of the better looking gaps today in tech land, with most others showing V-shaped bounces.

13
3,098
AsymTrading retweeted

Mostly bounces into descending MAs, which is starting to look like bear flags in a lot of names.
Not seeing much of anything to get involved with until we see higher lows.
Many tech stocks are gapping higher this morning, but most are doing so directly into overhead resistance after sharp V-shaped recoveries. While the strength is encouraging, many of these gaps are occurring in less-than-ideal technical positions, limiting their immediate upside potential and making them more vulnerable to selling pressure.

Despite recent volatility, encouraging signs are developing beneath the surface. Breadth and momentum indicators are beginning to stabilize, with new lows no longer expanding and the number of stocks moving sharply lower starting to contract. Meanwhile, my base watchlist scan has grown from roughly 40–80 stocks to more than 120, suggesting that more stocks are holding near recent highs and reclaiming their 10- and 20-day moving averages.
None of this confirms that the market has turned the corner, but these are encouraging early signs of improving internal strength and growing participation. It's worth watching, especially when the major indices still look relatively weak and volatile.
As an aside, I've historically been an anti-gapper, mainly because I struggled to consistently profit from gap setups. It didn't seem to matter which approach I tried, whether it was Qullamaggie, Stockbee, or the O'Neil disciples. I studied the strategies, experimented with different variations, and just couldn't seem to make them work consistently.
But something interesting happened as I continued trading my normal swing setups. I started noticing these smaller "mini-gaps" that often preceded strong moves and offered opportunities to get in relatively early. Eventually, I realized they shared many characteristics with PTS gaps and Mark Boucher's TBBLBG methodology for identifying stocks under strong institutional accumulation.
Lately, I've been having some pretty good success with these mini-gaps, catching strong moves in names like $INO, $KRMN, $QXO, $TMDX, and others. What's interesting is that I'm not necessarily trading gaps for the sake of trading gaps. I'm recognizing them as part of the price and volume behavior I've already been looking for in my swing setups.
Qullamaggie once talked about transitioning almost exclusively to gap setups, and while I'm certainly not at that point, I can better appreciate why he gravitated toward them.
If there's one thing I've learned after two decades of trading, it's that you never stop learning, experimenting, and refining your approach. Sometimes the setups you dismissed years ago become valuable once you learn to see them through a different lens.
We'll see where this gap experiment leads, but so far, the results have been promising, especially considering how difficult and unforgiving this market has been.
Not all gaps are created equal. The Professional Trading Strategies (PTS) approach classifies gaps into three levels based on their technical characteristics, including prior price action, resistance levels, room to move, and relative strength. Understanding these differences helps traders identify higher-quality opportunities, evaluate risk, and determine the appropriate entry strategy.
Key Questions When Evaluating a Gap
Destination: Where is the stock gapping to?
Starting Point: Where is the stock gapping from?
Shock Value: Does the gap represent a significant change in price or market sentiment?
Gap Size: Does it clear key support or resistance without becoming overly extended?
Room to Move: Is the stock gapping into open space (void) or nearby resistance?
Relative Strength/Weakness: Is the stock outperforming or underperforming the broader market?
Bottom line: The strongest gaps create a meaningful shift in supply and demand, clear important price levels, and leave sufficient room for continued movement.

Not all gaps are created equal. The Professional Trading Strategies (PTS) approach classifies gaps into three levels based on their technical characteristics, including prior price action, resistance levels, room to move, and relative strength. Understanding these differences helps traders identify higher-quality opportunities, evaluate risk, and determine the appropriate entry strategy.
Key Questions When Evaluating a Gap
Destination: Where is the stock gapping to?
Starting Point: Where is the stock gapping from?
Shock Value: Does the gap represent a significant change in price or market sentiment?
Gap Size: Does it clear key support or resistance without becoming overly extended?
Room to Move: Is the stock gapping into open space (void) or nearby resistance?
Relative Strength/Weakness: Is the stock outperforming or underperforming the broader market?
Bottom line: The strongest gaps create a meaningful shift in supply and demand, clear important price levels, and leave sufficient room for continued movement.
As an aside, I've historically been an anti-gapper, mainly because I struggled to consistently profit from gap setups. It didn't seem to matter which approach I tried, whether it was Qullamaggie, Stockbee, or the O'Neil disciples. I studied the strategies, experimented with different variations, and just couldn't seem to make them work consistently.
But something interesting happened as I continued trading my normal swing setups. I started noticing these smaller "mini-gaps" that often preceded strong moves and offered opportunities to get in relatively early. Eventually, I realized they shared many characteristics with PTS gaps and Mark Boucher's TBBLBG methodology for identifying stocks under strong institutional accumulation.
Lately, I've been having some pretty good success with these mini-gaps, catching strong moves in names like $INO, $KRMN, $QXO, $TMDX, and others. What's interesting is that I'm not necessarily trading gaps for the sake of trading gaps. I'm recognizing them as part of the price and volume behavior I've already been looking for in my swing setups.
Qullamaggie once talked about transitioning almost exclusively to gap setups, and while I'm certainly not at that point, I can better appreciate why he gravitated toward them.
If there's one thing I've learned after two decades of trading, it's that you never stop learning, experimenting, and refining your approach. Sometimes the setups you dismissed years ago become valuable once you learn to see them through a different lens.
We'll see where this gap experiment leads, but so far, the results have been promising, especially considering how difficult and unforgiving this market has been.
7
1,026
AsymTrading retweeted

I studied Martin Luk's 2026 trades, and the system which won him the USIC and generated +969.8% in 2025, +844.5% through Aug 2026, and 150%+ in Oktober alone.
No 0DTEs. No Options. No futures.
This article will change your trading career.