

Sharing info on COVID since the start of the pandemic
- Tweets31.5K
- Following3K
- Followers18K
- Likes72.9K







ALT Screenshot of a news article about COVID-19 vaccine safety, featuring the headline “‘It’s The Best-Studied Vaccine In Human History’: Former CDC Adviser Busts Common Myths About COVID Vaccines.” - Headline: A former CDC adviser discusses COVID-19 vaccine safety and challenges common misconceptions. - Main image: A vaccine vial and syringe in front of a glowing blue protective shield decorated with antibody symbols. - Background: Large red coronavirus particles appear against a blue and red scientific illustration. - Right side: A circular photograph of a grey-haired man wearing glasses, above the words “COVID VACCINE SAFETY.” - Publication: Written by Nisha Pandey, updated October 25, 2026, at 7:00 PM IST. - Image credit: X.

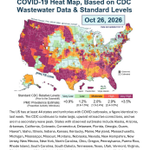
ALT US COVID-19 heat map dated October 26, 2026, from the Pandemic Mitigation Collaborative (PMC), based on CDC wastewater data updated October 17. - Very Low (pale green): Under 0.9% estimated infectious. - Low (green): 1.2% (0.9–1.5%). - Moderate (orange): 2.0% (1.5–2.4%). - High (red): 2.9% (2.4–3.5%). - Very High (purple): Above 3.5%. - Geographic trends: Widespread high and very high activity across the West, South and parts of the East, with lower levels across portions of the Midwest. - Outbreaks: At least 44 states and territories affected, unchanged from last week. - National trend: A secondary wave peak is reported, with large upward retrospective CDC data corrections. - Data limitations: Poor wastewater monitoring may conceal additional outbreaks. Map distinguishes observed and estimated county-level data.

ALT National COVID-19 Estimates (U.S.), October 26, 2026, from the Pandemic Mitigation Collaborative (PMC) model at pmc19.com. The table presents estimated infections, Long COVID cases and excess deaths. - Actively infectious: 1 in 60 Americans (1.7%). - New daily infections: 822,000. - Past week's infections: 5,890,000. - Infections in 2026: 160 million. - Cumulative infections per person: 5.64. - Long COVID from daily infections: 41,000–164,000 estimated cases. - Long COVID from weekly infections: 295,000–1,180,000 estimated cases. - Excess deaths from daily infections: 200–350 estimated. - Excess deaths from weekly infections: 1,400–2,500 estimated. All figures are model-based estimates, not confirmed case counts.

ALT PMC COVID-19 State Prevalence Estimates, October 26, 2026. Table showing estimated active infections across 25 US states and territories, CDC wastewater levels and infection probabilities. - Highest prevalence: Florida 6.1% (1 in 16), Hawaii 5.1%, Connecticut 4.5%, Guam 4.3%, California 3.9%. - High prevalence: Maryland 3.5%, Delaware and Idaho 3.2%, Arkansas 2.9%, Mississippi 2.8%, Arizona 2.5%, Massachusetts 2.4%. - Moderate: Colorado 1.8%; Alabama, Illinois and Kansas 1.6%; DC and Maine 1.4%; Georgia 1.3%; Louisiana 1.2%. - Lowest: Michigan 0.9%, Minnesota 0.8%, Alaska 0.7%. - Exposure risk: In a room of 10, estimated probability ranges from 7% in Alaska to 47% in Florida; Florida exceeds 99% in a room of 100. - Notes: Red shading highlights higher prevalence. CDC categories were revised downward in August 2026. Data updated October 17; some reporting is limited.

ALT PMC COVID-19 State Prevalence Estimates, October 26, 2026. Table showing estimated active infections, CDC wastewater levels and exposure probabilities across 27 US states and territories. - Highest prevalence: Oregon and Washington 6.7% (1 in 15), Puerto Rico 6.0%, Montana 5.9%, Tennessee 4.5%, Nevada 4.3%. - High prevalence: South Dakota 3.9%, New Mexico and North Dakota 3.5%, Rhode Island 3.3%, Virginia 3.2%, South Carolina 3.1%. - Elevated: North Carolina and Utah 2.8%, Texas 2.7%, Missouri 2.4%, New Jersey 1.9%. - Lowest: New York, Ohio, Oklahoma and West Virginia 0.5%; New Hampshire 0.7%. - Exposure risk: In a room of 10, estimated probability reaches 50% in Oregon and Washington; over 99% in a room of 100. - Notes: Red shading indicates higher prevalence. CDC categories revised downward in August 2026. Limited reporting in some states; data updated October 17.

ALT PMC graph of estimated new daily SARS-CoV-2 infections in the US, based on wastewater data from 2020 to October 26, 2026. - Graph: Red line shows successive COVID-19 waves, with daily infections ranging from near zero to over 5 million. - Largest wave: Early 2022 (Omicron), exceeding 5 million daily infections. - Other major peaks: Approximately 2.7 million in early 2024 and 2.3 million in late 2024. - 2025: Multiple waves, including peaks around 1.7 million and 1.6 million daily infections. - 2026: Infections declined early in the year before rising again toward 1 million daily. - Current trend: A developing 13th wave is shown, following 12 identified waves. - PMC estimates: An average of 5.6 infections per person and 14.1 months between infections. - Note: The most recent nine days are preliminary estimates.

ALT National COVID-19 Risk Table (U.S.), October 26, 2026, from the Pandemic Mitigation Collaborative (PMC) model at pmc19.com. Shows the estimated probability that at least one person in a group is infectious with COVID-19. - 1 person: 1.7%. - 2 people: 3.3%. - 3 people: 4.9%. - 4 people: 6.5%. - 5 people: 8.1%. - 10 people: 15.5%. - 15 people: 22.4%. - 20 people: 28.7%. - 25 people: 34.4%. - 30 people: 39.7%. - 50 people: 57.0%. - 75 people: 71.8%. - 100 people: 81.5%. - 200 people: 96.6%. - 300 people: 99.4%. The table uses alternating pale blue and white rows. Estimated probability increases with group size. Figures represent the chance that someone is infectious, not the chance of transmission.

ALT Screenshot of a Medical Dialogues article titled “Long COVID Linked to 14 Percent Higher Risk of Developing Hypertension: Study,” published October 26, 2026. - Headline: Long COVID is associated with a 14% higher risk of developing hypertension (high blood pressure). - Publication: Medical Dialogues, written by Medha Baranwal and medically reviewed by Dr. Kamal Kant Kohli. - Main image: A hand with two fingers pointing downward toward wooden letter blocks spelling “LONG COVID.” - Background: The wooden blocks rest on a flat surface against a warm orange background. - Overall message: The article highlights research linking long COVID with an increased risk of developing high blood pressure.


ALT Screenshot of a Bioengineer.org article published October 25, 2026, titled “Blood Test Combining IL-6 and Neutrophil Levels Predicts COVID-19 Death Risk in Hospitalised Adults.” - Headline: Research highlights a blood test combining IL-6 and neutrophil levels to predict COVID-19 mortality risk in hospitalised adults. - Publication: Bioengineer.org, Health section, October 25, 2026. - Image: A blue-toned laboratory scene showing a scientist wearing protective gloves holding a blood sample tube. - Background: A laboratory analyser, a computer monitor displaying a rising graph, and racks of blood sample tubes with blue caps. - Overall message: Blood-based inflammatory markers may help identify hospitalised COVID-19 patients at greater risk of death.


ALT Journal of Korean Medical Science infographic titled “Crowded Spaces, Contagious Risks”, examining COVID-19 cases following outdoor university concerts in South Korea, 2022. - Background: Crowded outdoor concerts and COVID-19 transmission risks. - Methods: University COVID-19 reports collected through mobile applications and compared with community surveillance data. - Results: 138 reported COVID-19 cases following the festival, averaging 5.8 cases daily. - Graphs: Cases rose following the early May event, exceeding expected levels based on community trends. - Comparisons: Original, pointwise and cumulative analyses illustrate the increase in cases following the festival. - Conclusion: Large, crowded outdoor gatherings can increase COVID-19 transmission risks, even when community cases are declining.

ALT World Health Organization (WHO) global SARS-CoV-2 surveillance map showing COVID-19 test positivity rates for 12–18 October 2026. Countries are colour-coded by percentage of positive tests: - 0–10% (light pink): Australia, Canada, Russia, India and several European and African countries. - 11–20% (salmon): Spain, parts of Europe and several African countries. - 21–30% (red): Small areas of Europe and Africa. - Above 30% (dark red): Algeria, North Africa, showing the highest positivity category. - Not reported (cream): United States, China, Brazil and many countries across Africa, Asia and South America. - No information (grey): Greenland and parts of southern Africa. The map also distinguishes areas with no applicable data or denominator. White or cream areas should not be interpreted as having zero COVID-19 transmission.


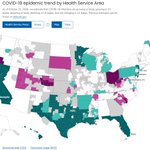
ALT US CDC map titled “COVID-19 epidemic trend by Health Service Area”, dated 21 October 2026, showing whether COVID-19 infections are increasing, decreasing or remaining stable across the United States. - Growing or likely growing: 10 states. - Declining or likely declining: 15 states. - Not changing: 24 states. - Purple: Growing infections, notably in Ohio and parts of the western US. - Pink: Likely growing, including South Dakota and parts of Colorado, Utah and the Carolinas. - Light teal: Likely declining, including Wisconsin, Michigan and Pennsylvania. - Dark teal: Declining, including California, Florida, Hawaii and much of Texas. - White: No significant change detected. - Grey: Insufficient data to estimate trends. The map shows regional differences within states, with trends varying between health service areas.

ALT Screenshot of a PBS News article about science YouTuber Dianna Cowern, known as Physics Girl, and her struggles with Long COVID. - Headline: “‘Nobody knows what to do’: How Long COVID left Physics Girl searching for answers.” - Photograph: Dianna Cowern smiling while sitting upright against white pillows, wearing a dark green sweatshirt. She has brown hair pulled back, dangling earrings and blue eyes. - Background: A warmly lit room with peach-coloured walls and decorative fairy lights. - Article description: Cowern, a popular science communicator from San Diego, developed Long COVID, leaving her bedbound and searching for medical answers. - Website: www.kpbs.org. - Main message: The article highlights the severe, life-changing effects of Long COVID, even for previously active and successful individuals.