

Big Earth Data is the world's first big data journal in the Earth sciences.
Joined October 2020
- Tweets355
- Following853
- Followers574
- Likes252





📢 Earth Foundation Models outperform traditional deep learning architectures for coastal ecosystem semantic segmentation and large-scale habitat mapping by Daniel Jacome, Jianghao Wang & Yong Ge
👉 doi.org/10.1080/20964471.202…
💌 #Coastal ecosystems face escalating threats from #climate-driven sea-level rise and anthropogenic modification, necessitating precise, scalable monitoring for effective conservation and blue-carbon accounting. Traditional #deeplearning models (e.g., #UNet and #DeepLabV3) struggle with boundary delineation and spectral confusion in heterogeneous coastal transition zones. Earth Foundation Models (#EFMs) pre-trained on massive Earth observation archives encode transferable spectral–spatial–temporal representations that address these challenges through dynamic channel adaptation, multi-scale feature extraction, and long-range dependency capture. This study establishes a benchmark of fine-tuned EFMs against traditional architectures for coastal semantic #segmentation, using annual #Sentinel-2 composites across 85 patches from 17 nations and evaluating six metrics including boundary IoU and edge F1-score across five spectrally ambiguous classes. DOFA achieved the highest performance (0.98 mean accuracy, 0.95 mIoU, 0.46 Bd-IoU, 0.62 Edge-F1), outperforming the best traditional model by 4.4% absolute mIoU. Ablation studies show encoder-only fine-tuning preserves 98.9% of end-to-end performance (0.94 vs. 0.95 mIoU), whereas decoder-only fine-tuning reduces trainable parameters by 95.5% but catastrophically degrades accuracy to 0.83 mIoU. Computational analysis confirms operational feasibility at regional scales. These findings establish EFMs as transformative, actionable tools for high-fidelity coastal conservation, ecological restoration, and #blue-carbon inventorying.
#coastalecosystems #semanticsegmentation #EarthFoundationModels #environmentalmonitoring #geography #bigearthdata #digitalearth #geoscience #remotesensing #earthobservation #GIS #dataanalysis #BigData
📢 Mid-season parcel-based crop type mapping using multi-source time series of big Earth observations and deep learning by Hazhir Bahrami, Saeid Homayouni, Catherine Champagne, Heather McNairn, Bahram Daneshfar, Karem Chokmani, Anastase Nteziyaremye & Ariel Zannou
👉 doi.org/10.1080/20964471.202…
💌 Accurate and timely #croptype #mapping offers a wide range of benefits, from supporting annual #crop inventories and #agriculturalmonitoring to enabling sustainable resource management and a deeper understanding of #landscape dynamics. This study proposes a practical framework for mid-season parcel-level #cropclassification utilizing models derived from past #EarthObservation (EO) and training data, eliminating the necessity for additional training data collection for future inference. Utilizing #Sentinel-1 #SAR and #Sentinel-2 optical data with a 21-day interval from April 1 to August 4, major crop types were mapped in the province of #Quebec during the growing season spanning 5 years (2020–2024). Finally, the most accurate trained models were used to predict the crop types of 2025 to ensure the accuracy and transferability of the trained models. This study took into account several important crops, such as corn, soybeans, wheat, and hay. Two #machinelearning models and four #deeplearning models, including #Transformers, were utilized for multitemporal crop mapping. Additionally, crop mapping was performed using Google’s #AlphaEarth annual dataset and ML algorithms, and the results were compared with Sentinel-1 and Sentinel-2 data. Our findings indicated that the Transformers outperformed other models when using Sentinel-1 and Sentinel-2 data, achieving an overall accuracy of 0.97 on the validation data and 0.93 on the test data. Using Google’s AlphaEarth data, RF delivered a comparable accuracy, with overall accuracies of 0.96 and 0.92 for the validation and test data, respectively. The generated crop type maps for unseen 2025 data in this study show the practicality of the proposed framework to perform mid-season parcel-based crop mapping without the need for additional in-year field data.
#agriculture #precisionagriculture #bigearthdata #digitalearth #geoscience #remotesensing #earthobservation #GIS #dataanalysis #BigData
📢 Nonlinear mobility responses to heat in the United States: benchmark thresholds and neighborhood inequality by Sooyoung Lim, Ruixiang Liu & Zhenlong Li
👉 doi.org/10.1080/20964471.202…
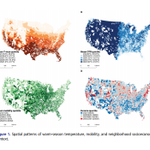
💌 #Extremeheat is commonly defined using climatological thresholds, but such definitions do not directly capture when daily activity begins to weaken under thermal stress. This study estimates a #mobility-based behavioral #benchmark for heat and examines whether post-benchmark mobility decline varies across neighborhood socioeconomic contexts in the contiguous United States. Using anonymized census tract-day mobility data from 2018 to 2024, linked to daily #weather conditions, we analyze warm-season mobility responses to #temperature with high-dimensional fixed effects, spline Poisson models, and piecewise Poisson threshold models. The pooled national mobility-temperature relationship is nonlinear. Predicted mobility rises through a moderate warm range, peaks near 26.7°C, and then declines at higher temperatures. In the pooled piecewise model, the benchmark turning point is estimated at approximately 23.0°C, with an uncertainty band of 22.0–26.0°C. Income-stratified models show that heterogeneity is expressed more clearly in post-benchmark slope magnitude than in benchmark location, with the steepest post-benchmark decline appearing in the lowest-income quartile, while higher-income quartiles show more moderate declines. Tract-level maps of post-benchmark heat exposure and modeled mobility burden further show that larger modeled burdens appear across parts of the South and Southwest, although substantial within-region variation remains. These results suggest that behavioral disruption under heat reflects thermal #exposure, local context, and unequal neighborhood-level capacity to sustain routine activity once temperatures move beyond a broadly shared benchmark. This approach complements climatological heat definitions with an empirically estimated mobility-sensitive threshold.
#Humanmobility #behavioralthreshold #heatadaptation #locationdata #urbangeography #climatehazards #spatialstatistics #GIScience #GeoAI #transportation
#bigearthdata #digitalearth #geoscience #remotesensing #earthobservation #GIS #dataanalysis #BigData
📢 SAGE-UNet A mixture-of-experts spatially-aware gated enhancement U-Net for flood water segmentation from Sentinel-1 SAR and post-event impact assessment—learning from flood events in Germany and Spain by Armin Moghimi, Alireza Bahrami Mahtaj, Ali Jamali, Mario Welzel, Mahdi Motagh & Torsten Schlurmann
👉 doi.org/10.1080/20964471.202…
💌 The increasing frequency and intensity of floods pose substantial risks to residential areas, infrastructure, and economic systems, highlighting the need for reliable #flood mapping to support emergency response and damage assessment. Even though synthetic aperture radar (#SAR) facilitates all-weather flood monitoring, speckle effects and intricate surface backscattering mechanisms make precise flood delineation challenging. To address these, we propose a hybrid #floodmapping framework centered on a Mixture-of-Experts Spatially-Aware Gated Enhancement U-Net (#SAGE-#UNet) for post-event segmentation using #Sentinel-1 SAR imagery. This architecture incorporates #polarization-specific denoising to minimize the impact of speckle effects and a spatially aware bottleneck to improve the representation of #contextual features. To further reduce false alarms and missed detections, particularly in vegetated regions, we introduce a lightweight bi-temporal refinement module that combines discrete wavelet transform (#DWT)-based change detection with context-guided morphological reconstruction using normalized difference vegetation index (#NDVI)-derived vegetation constraints and hazard-related spatial priors. The framework was evaluated on two major European flood events (#Hannover, Germany, December 2023; #Valencia, Spain, October 2024). The experimental results demonstrated that the standalone SAGE-UNet achieved IoU improvements of 1.7% and 2.3% over the strongest #CNN- and #transformer-based baselines on the Hannover and Valencia datasets, respectively. After bi-temporal refinement, the complete framework achieved relative IoU improvements of 7.8% and 15.8%, over the strongest competing methods on the Hannover and Valencia datasets, respectively. The refinement also improved spatial consistency by reducing false alarms and missed detections and better delineating flooding beneath vegetation. #LULC analysis also confirmed the framework’s utility for flood exposure assessment, identifying agricultural areas and infrastructure within floodplains as the most affected classes. These results demonstrate the framework’s potential for operational SAR-based flood mapping and impact assessment.
#Floodmapping #deeplearning #mixture-of-experts #GeoAI #changedetection #disaster #risk #bigearthdata #digitalearth #geoscience #remotesensing #earthobservation #GIS #dataanalysis #BigData
📢 On the sensitivities to the modifiable areal unit problem by Xiang Ye & Jiayi Chen
👉 doi.org/10.1080/20964471.202…
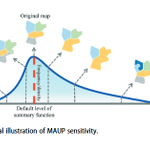
💌 The impacts of the modifiable areal unit problem (#MAUP) on the analysis results have long been documented in empirical studies of many disciplines, in particular, the diversified appearance and degrees of #sensitivities of geographical variables and observations. Despite diligent efforts, there remains epistemological insufficiency in expressing sensitivities to the MAUP in a unified and consistent manner, compromising the clarity and reliability of the analysis results. To address this issue, a conceptual and methodological framework has been proposed to systematically define and quantify the sensitivities of a geographical observation to different aspects of the MAUP in a probability-based approach, exemplified by demographic, socio-economic, and environmental datasets. The proposed framework aims to provide a theoretically grounded foundation for unambiguous communication and more in-depth investigations of MAUP-related #sensitivity analyses, promoting more rigorous and replicable geographical research involving spatially aggregated data.
#Modifiablearealunitproblem #sensitivity #geographicalobservation #probability #deviationdistribution #spatialstatistics #Geography
#bigearthdata #digitalearth #geoscience #remotesensing #earthobservation #GIS #dataanalysis #BigData