

Suburban Demigod & One Of The Very Best Horseplayers That You Have Never Heard Of.😎 I Handicap Pace Not Speed. You Had Me At “The Turf Is Firm”😂😂
Florida, USA
Joined July 2023
- Tweets5.2K
- Following1.7K
- Followers1.1K
- Likes7.4K




Pinned Tweet
@JulieRamgeet @RaymondCiampic1
Is it just me or does @jockeykdavis look like hired muscle for @TheNYRA This gentlemen wanted a senior citizens discount. And walked away making a $100 win bet on her horse!😂😂 I just minded my business. Good luck in the G2 Ballston Spa!💪🏽💪🏽

Belmont Race 4
EXDC Analysis
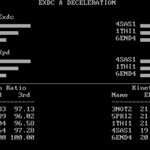
The 2 brings the strongest early EXDC and the best third-fraction retention the bettors may find this one harder to soften up than expected. 5 leads Late and Total EXDC, waiting to collect if the front end gets careless. 7 tops Total Kpd, but that weaker finishing retention could turn its early ambition into a disciplinary hearing. 2 and 5 bring the leather; 7 better bring an explanation.

1
62

DEL MAR RACE 1
$65,000 Maiden Special Weight
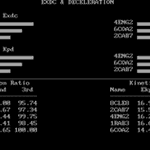
EXDC projects a sustained race environment where energy distribution and maintaining velocity through the finish become critical. The 4 leads Late EXDC, Total KPD, and Total EXDC, displaying the strongest sustained profile in the field. The 1 offers an intriguing balance of early exertion and late energy preservation, making her a legitimate contender. The 5 dominates Early EXDC but faces the challenge of carrying that early exertion through a race favoring sustained energy. The 4 and 1 are the primary contenders, with the 4 showing the strongest alignment with today's projected race demand.

BELMONT RACE 7
EXDC & DECELERATION
The 4 emerges as the strongest contender, ranking first in Late EXDC, Total KPD, and Total EXDC while maintaining remarkably consistent deceleration ratios of 98.48, 98.44, and 99.75. The 6 presents the most dangerous sustained threat, improving from 94.84 through 96.65 to 100.00 in the third segment, suggesting an energy distribution particularly suited to a pressured race. The 8 dominates Early EXDC but declines to 95.74 in the final segment, raising concerns about its ability to withstand sustained pressure. The 2 offers additional late-running potential, but the 4 possesses the most compelling combination of energy distribution, consistency, and overall EXDC superiority.
Primary contenders: 4 and 6, with the 2 as the secondary threat.

1
85
BELMONT RACE 6
EXDC & DECELERATION
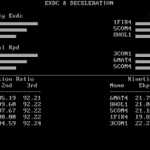
The 3 and 6 dominate the overall energy distribution, with the 3 leading Total KPD and Total EXDC while the 6 controls Early EXDC. The 3 possesses the strongest opening deceleration ratio at 100.00, but its decline to 95.19 and 92.21 raises questions about sustaining that initial advantage. The 6 demonstrates a more balanced early-to-middle distribution at 95.70 and 99.60, making it particularly interesting if the race favors horses maintaining their velocity through the second fraction. The 1 leads Late EXDC and deserves consideration if the early contenders expend too much energy, while the 5 remains a secondary contender based on its overall EXDC ranking.
r

1
76
Belmont Race 5 presents a significant separation in ENTROPY's EXDC distribution, with the four maintaining a commanding Kinetic Median advantage throughout the race. The five demonstrates the strongest sustained distribution among the remaining contenders, while the six and three exhibit nearly identical patterns of energy deterioration. The one begins with considerable kinetic strength but experiences the sharpest decline, raising concerns about its ability to sustain its effort. The four is the clear standout, with the five offering the strongest challenge based on the modeled energy distributions.
selections 4-5-6

1
65
PACE HANDICAPPING THOUGHT OF THE DAY
DECELERATION VS. SUSTAINED ENERGY
How Important Is Velocity After The Initial Demand Has Taken Hold?
Many people know about pace handicapping and focus on how fast a horse ran a certain race. How fast they ran to the second call and what time they finished the race in. While all of these are valid and can be beneficial information to know about a horses performance. They don't tell you how that horse was able to produce those numbers. What did his velocity look like as he continued to race and the demands of the race started to take effect?
All horses will have a certain amount of energy to put forth in a race. How they go about using that energy can dictate how far that horse will continue to run or even gain on others once the race starts. If a horse goes out fast and burns a lot of energy during those initial fractions. They may be able to gain an advantage on their competitors but will start to show weakness as their velocity decreases at a higher rate then that of there competitors. On the opposite end if a horse can keep there velocity steady they will have more energy to give once the rest of the field starts to slow down. This is what we look for when analyzing deceleration.
Deceleration is the loss of velocity. Sustained energy will tell you how much energy a horse was able to use towards the middle and end of a race. Although they both are related to one another they are not the same thing. You can have a horse that will sustain but may not be fast enough to beat others. Or a horse that may show deceleration but still be faster then everyone else on the track. You want to find that horse that can maintain its velocity and be fast enough to beat the rest of the field based off todays conditions.
DECELERATION & SUSTAINED PACE
When looking at Sustained Pace we look at a horses 2nd and 3rd fraction. We want to see if the horse can run good velocity past their first fraction and carry that into the end of the race. Just because a horse has good Sustained Pace doesn't mean they are going to run fast enough to beat others. They may just have the ability to keep their velocity steady throughout their run.
This is where Deceleration comes into play. With Sustained Pace we know how fast that horse was able to run in the middle and end of their race. But deceleration will allow us to see if they were able to run that fast while slowing down less then others on the track. You can have two horses with the same Sustained Pace rating. But one may have had a very fast 2nd fraction and slowed down significantly during the last fraction of there race. While the other horse may have been able to sustain there velocity throughout the race and came in with good velocity at the end of there race. So while both horses have good Sustained Pace they got that number different ways.
When looking at these types of runners you want to know what kind of pace they ran against. They may have had good velocity during their last fraction but did they have to race against any type of speed? If they were able to keep their velocity while running against slower fractions then they may struggle once they have to race against better speed. So keep that in mind when trying to handicap off of these numbers.
Second Call Velocity vs Last Fraction Velocity
As we all know the second call can play a big role when analyzing horses. But not many know that when we look at second call velocity and compare it to their last fraction. We can start to see how a horse will perform after most of their race has already been established.
Don't confuse second call velocity with second fraction velocity. Second call velocity will tell you what velocity the horse averaged from the beginning of the race to the second call. Where second fraction velocity will only tell you what velocity the horse ran between the first and second call. So when looking at acceleration/deceleration make sure you are not comparing apples and oranges.
If you see a horse that can run good velocity to the second call and maintain their velocity at the end of the race. That's always a good sign. Just remember to see what type of speed they were racing against. They may have been running free the whole way and never had to face any real competition until the end of the race.
So Why Do We Want To Know All Of This Information?
Lets say we have two horses that can both race. The first horse has showed better velocity and is able to finish races in better time then our second horse. But each time our first horse races they seem to show deceleration during the last fraction of their race.
Our second horse may not be as fast to the second call but are able to finish the race with better velocity at the end of their race. Well depending on what kind of race your looking at you may have a better chance with the first horse. As long as they can keep their velocity ahead of the rest of the field. But once you start adding more pressure onto the race you may find your self looking at the second horse. Because our first horse will have to work harder to keep there normal position in the race. Which means they will burn more energy and may slow down even more during their final fraction. Our second horse may find itself in a situation where it can take advantage of that.
Its all about finding that balance between velocity and how your going to use your energy. Neither horse is going to magically gain or lose speed. But you want to know what type of race your going to have and who can capitalize.
There Is No Straight Line To Your Energy Distribution
Another reason why its hard to analyze a horse based off of energy. Is that your never going to get a perfect straight line out of a horse. There are going to be times where they may speed up and times where they may slow down. Depending on how they react to their competition and what the track is asking of them. So when you look at deceleration you want to make sure that your looking at all factors that could have played a role in that horse's performance.
Just because a horse may show good deceleration doesn't mean they are the fittest horse in the race. They may just happen to run their last fraction better then others. Which could be due to many different things. But it always gives you something to go on when trying to figure out what type of horse your dealing with.
You also want to look at what kind of velocity they are running to there last fraction. If they are running slower fractions and come in fast at the end. That's not the same as running fast fractions and coming in fast at the end. There could be a big difference in that horses performance when you add speed to the race.
Putting It All Together
As you can see there are many things to consider when trying to find a horse that will be able to sustain there energy. Once you start looking at turn time, hidden energy and factor x you'll begin to understand how these numbers can play a role in your selections. Each one can help you understand what a horse did during their race and how they were able to do it.
You may have a horse that shows great velocity at the end of their race but dont have the Total Energy to back that up. Or they may have great Total Energy but are not distributing it correctly. Its all about finding that sweet spot between all of these factors and picking the best horse to win todays race.
Which brings us back to the question of ability vs. suitability. You can have all the ability in the world but if you aren't suited to todays race your going to have a hard time winning.
Final Thoughts
So as we've seen Deceleration and Sustained Energy go hand in hand when it comes to pacing. We want to know how fast a horse can run and how their velocity changes as they race. Then we want to see how they are able to distribute their energy throughout their race.
Just because a horse can run the slowest rate of deceleration doesn't mean they are going to win. They still need to have enough velocity to beat others and be able to maintain that velocity to the wire.
Thats what pace handicapping is all about. Finding that horse that can take on what's being asked of them and be successful.
Velocity will tell you how fast a horse ran. Deceleration will tell you how their velocity changed. And Sustained Energy will help you figure out how they were able to run those fractions. Once you understand how all of these work together you'll be able to find more winners than you ever thought possible.
@RaymondCiampic1
PACE HANDICAPPING THOUGHT OF THE DAY
DECELERATION: The Price Of Velocity
A Brief Explanation on Absolute Deceleration, Relative Deceleration and What It Can Cost You To Run Fast Early.
Its always fun to see horses run fast early. Great fractions and speed and time. But what about their deceleration? How does a horse run out of gas towards the end of a race. Sure your favorite took a big lead in the early going but started to lose ground near the end of the race. Or maybe your favorite seemed to be accelerating near the end of the race when they really were just passing slower horses. Maybe they weren't actually accelerating they just were losing velocity at a slower rate then the competition. You have to know the difference and look at velocity when trying to understand this.
When something moves with velocity and changes that velocity you are accelerating. If that velocity slows down you are decelerating. Now just because a horse is decelerating it doesn't mean they are gassed. They could run out of gas in the last half of the race and still come away with an easy victory. Each horse can only put out so much physical output and if you force them to go fast early it will affect what they have left for the finish. This is what Huey Mahl talked about with his theory on the telescopic effect of running fast early. Your fractions in the beginning of a race play into what they can put out towards the end. If you require a horse to expend themselves at a high level early on they may not have as much to give later on. Especially if they have to keep up with other competition.
There are two ways to look at deceleration. Absolute and relative. As stated above if your horse runs 60 feet a second over one fraction and then slows down to 55 they lost 5 feet a second. If another horse ran 57 feet a second and slowed to 54 they only lost 3 feet a second. Although they lost more speed then the competition they were still going faster. These aren't true numbers of deceleration as well they are only telling you what there average fraction velocity was. But you can see why you have to look at what they slowed from when analyzing velocity.
Relative deceleration looks at those numbers and compares them to others. Just because your horse may be running out of steam they could still appear to be accelerating because the rest of the field is running out of gas. We all see horses that seem to be coming around the turn flying. Maybe they are accelerating. Maybe they are just running at a faster velocity then the rest of the field. Either way you can have a horse win both ways. You just have to understand what your looking at when handicapping if a horse can duplicate there speed and deceleration under different circumstances.
The 2nd fraction is where you want to pay close attention to see if a horse is paying the price of running fast early. Turn Time looks at this area of the race to help you determine if they are on top of there game or slowing down. Always look at the finish to go along with a great second move. There is a big difference between a horse that comes around the turn making up ground and falls off hard. And one that makes a strong second move and holds on to the finish line. This is where programs such as KGEN and EXDC as well as ENTROPY came in handy with pace analysis. Allowing us to see graphical analysis of fractions and what a horse can expect when expending energy.
Of course you also want to see what kind of pace scenario you think your going to get. If your front runner gets away with an open lead he may have plenty of velocity left. But if he gets into a speed duel with another horse he could run out of gas earlier then normal. Which leads us into why ability and suitability are not the same thing. Your horse could be faster but maybe they aren't running efficient. Someone who is slower could run more efficient and have more velocity to give at the end of the race. You need both to be successful.
This is what we learn about when studying deceleration. How is your horse expending their speed? Are they able to hold on to their velocity? Remember your horse doesn't have to run there fastest time to win a race. They just have to be faster than the rest of the field. So it's not always who can decelerate the slowest it's who can hold on to their speed and have the ability to perform on the day that they are racing.
@RaymondCiampic1
1
6
5,144
BELMONT RACE 2
KGEN DECELERATION ANALYSIS
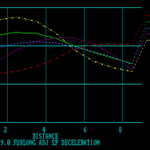
The KGEN deceleration graph reinforces our EXDC findings. The 8 displays the strongest late-energy profile, beginning with relatively modest early expenditure before improving its kinetic position as the race progresses. The 3 demonstrates a more balanced distribution, maintaining a competitive kinetic profile through the middle stages before gradually declining. Meanwhile, the 4 expends considerable energy early and experiences the most pronounced deterioration approaching the finish.

3
131
BELMONT RACE 2
EXDC & DECELERATION ANALYSIS
Belmont Race 2 features a $40,000 claiming event for New York-breds traveling 9 furlongs, originally scheduled for the inner turf but now moved to Tapeta. The EXDC analysis reveals a significant separation between early energy dominance and late kinetic potential. The 4 dominates the early EXDC rankings but shows considerably less late kinetic potential, raising questions about its ability to sustain that advantage. My top two selections are the 8 and 3, in that order. The 8 is my primary win contender, leading the late EXDC rankings with the strongest late kinetic potential in the field at 18.39. The 3 is my second choice, offering a more balanced energy distribution, ranking second in total EXDC while maintaining competitive third-fraction retention. The surface switch introduces additional uncertainty, but based on the available energy profiles, I'm looking at the 8 over the 3, subject to how their turf performances translate to Tapeta. The can be a threat if allowed to control the pace. Let's see how it plays out!

60
PACE HANDICAPPING THOUGHT OF THE DAY
EXDC: The Science Behind Energy Expenditure and Deceleration
Speed tells us how fast a horse can run. Understanding how that speed is distributed tells us something far more important.
For decades, handicappers have relied on speed figures and final times to determine which horses possess the greatest ability. There's certainly nothing wrong with knowing how fast a horse can run, but there's a question that deserves just as much attention. Why can two horses with nearly identical speed figures perform so differently when facing the same competition? Why does one horse establish a commanding early lead only to surrender it in the stretch, while another maintains its momentum and finishes strongly? The answer often has less to do with how fast those horses are and more to do with how they distribute their effort throughout the race. That distinction eventually became central to the development of EXDC, or Energy Expenditure Deceleration.
To appreciate where these ideas originated, we need to go back to the 1970s and a gentleman named Huey Mahl. His 1976 publication, The Race Is Pace, helped introduce a different way of thinking about thoroughbred performance. Mahl understood that the opening stages of a race could influence everything that happened afterward. He described the relationship as the telescopic effect of early pace, recognizing that an unusually demanding opening fraction could have consequences extending well into the latter stages. A horse might possess tremendous natural speed, but forcing that horse to expend too much effort early could compromise its ability to maintain that speed when it mattered most. What happened during the opening quarter wasn't simply another number in the past performances. It helped establish the conditions under which the remainder of the race would unfold.
Mahl's contributions deserve recognition because he encouraged handicappers to stop looking at fractional times as separate events. The opening fraction affects the middle fraction, and together they influence what a horse can accomplish during the final fraction. He also explored wagering mathematics, probability, and the relationship between winning percentages and profitability. His work helped establish an important foundation for the more sophisticated pace analysis that followed. Rather than asking only which horse had run the fastest race, handicappers were beginning to ask which horse had demonstrated the ability to distribute its speed most effectively under demanding circumstances.
Those ideas became part of the broader environment in which Howard Sartin and the PIRCO group began developing their approach to handicapping. PIRCO brought together horseplayers, researchers, programmers, and individuals interested in understanding racing performance through mathematics rather than conventional assumptions. Sartin recognized the importance of earlier research, but he wasn't content simply to accept every theory as established fact. In his 1990 ENERGY workbook, he discussed Mahl's proposed fractional weightings and described testing those assumptions against 1,000 races. His findings suggested different relationships between the fractions, particularly when examining different racing distances. That willingness to challenge existing ideas, test them against actual results, and continue refining the calculations became an important part of the methodology's development.
As computers became more accessible, these concepts evolved into increasingly sophisticated methods of analyzing fractional velocity, energy distribution, and deceleration. Instead of looking exclusively at early pace, sustained pace, or final time, handicappers could examine how a horse's performance changed throughout the entire race. Programs such as KGEN, ENERGY, and eventually EXDC provided different ways of studying those relationships. EXDC was particularly interesting because it examined energy expenditure and deceleration together, allowing the handicapper to consider not only how much speed a horse possessed, but what happened to that speed as the race progressed.
The physics behind EXDC is easier to understand than it might initially appear. Velocity describes how fast something moves in a particular direction, while acceleration describes how that velocity changes. When velocity decreases, we call it deceleration. A thoroughbred operates under the same basic physical principles as any moving body, although its performance is also influenced by complex biological processes. Producing speed requires muscular effort and metabolic energy, and sustaining that speed becomes increasingly difficult as fatigue develops. EXDC doesn't directly measure a horse's physical energy reserves. Instead, it uses fractional velocities and mathematical relationships to examine how racing effort is distributed and how performance changes from one portion of the race to another.
Consider two horses capable of producing nearly identical final times. One possesses exceptional early speed and establishes a substantial advantage during the opening stages, but its velocity deteriorates noticeably approaching the finish. The other begins more conservatively, gradually improves its position, and maintains a stronger finishing effort. Both horses might receive comparable speed figures, yet their performances tell entirely different stories. The first demonstrates an advantage in early exertion, while the second exhibits a more sustained distribution of effort. Neither horse is automatically superior. The question is which distribution will be more effective against the competition and pace conditions it encounters today.
This brings us to the distinction between Early EXDC and Late EXDC. Early EXDC examines the relationship between initial velocity, early exertion, and the deceleration that follows. A horse possessing a substantial early advantage may experience considerable deceleration and still win because its competitors cannot overcome the advantage established during the opening stages. Late EXDC examines the ability to preserve competitive velocity as the race progresses, particularly when early pressure begins taking its toll. A horse with favorable sustained characteristics may become dangerous when the leaders have expended more effort than they can comfortably maintain. However, there's an important distinction that should never be overlooked. A horse that decelerates less isn't necessarily the fastest horse, and a horse that decelerates more isn't necessarily incapable of winning. Everything must be considered relative to the demands of the race.
One of the more fascinating developments was the ability to represent these relationships graphically. Instead of relying entirely upon columns of numbers, handicappers could examine curves illustrating changes in fractional performance. These graphs bear a visual resemblance to trajectory analysis used in physics and engineering, where changes in motion are plotted to better understand acceleration, deceleration, and the behavior of moving objects. There have also been accounts of individuals with aerospace backgrounds offering suggestions concerning graphical representations of racing performance, although the specific historical details remain unconfirmed. Regardless of their precise origins, these displays introduced a valuable perspective. They allowed handicappers to visualize where a horse demonstrated its greatest advantage, where that advantage began deteriorating, and how its performance compared with competing energy distributions.
Another important concept involved evaluating movement through the individual fractions rather than concentrating exclusively on the opening and closing stages. Early EXDC discussions included an illustration assigning different weights to movement occurring during the first, second, and third fractions, placing particular emphasis on the middle portion of the race. The calculations weren't literal measurements of physical energy, but they reinforced an important principle. A horse making a powerful move around the far turn hasn't necessarily demonstrated a winning performance. We must determine what that move required and whether the horse could sustain it through the finish. A horse that accelerates into contention only to weaken dramatically has demonstrated something very different from one that makes a comparable move and continues gaining ground through the wire.
This is where understanding the anticipated pace environment becomes essential. A race favoring early exertion may reward a horse possessing superior initial velocity, even when that horse experiences more deceleration than its competitors. Conversely, a race featuring substantial early pressure may create favorable conditions for a horse capable of maintaining its velocity longer. The same horse can appear exceptionally strong under one set of circumstances and surprisingly vulnerable under another. That's why interpreting energy distribution without considering the projected race environment can lead to misleading conclusions. The objective isn't simply to find the horse with the prettiest graph or the smallest decline in velocity. It's to determine which horse possesses the combination of ability and energy distribution most compatible with the race it's being asked to run.
Looking back, Huey Mahl helped establish an important understanding of how early exertion influences subsequent performance. Howard Sartin and the PIRCO group carried those broader concepts forward through research, fractional velocity calculations, computer programming, and increasingly sophisticated methods of evaluating energy distribution. EXDC became part of that progression, offering handicappers another way to examine the relationship between speed, exertion, and deceleration. The significance of this work wasn't that it eliminated uncertainty from horse racing. It was that it encouraged handicappers to ask better questions about what actually produces a winning performance.
And perhaps that's the most important lesson of all. A horse doesn't win simply because it decelerates the least, nor does it necessarily lose because it expends the greatest amount of energy early. It wins when its ability, distribution of effort, and the demands of the race come together in its favor. Understanding those relationships requires looking beyond isolated speed figures and examining the complete performance, from the opening fraction through the finish.
Speed tells us what a horse has accomplished. Energy distribution helps us understand how it accomplished it. Deceleration reveals what happened along the way. And the demands of today's race determine whether that performance is likely to be good enough.
@RaymondCiampic1
1
4,839
Florida was becoming unaffordable for young people long before Amendment 3 ever made it onto the ballot. Where was all this concern when housing prices went through the roof, homeowners insurance became a second mortgage, and working families were struggling just to get by? But now that homeowners finally get a little relief, suddenly Florida is going to turn into one giant retirement community with a few theme parks thrown in? Come on now. Nobody is saying local governments won't have to make adjustments, but why is cutting essential services always the first thing people threaten when taxpayers get to keep more of their money? How about we start asking where all the money is going and whether it's being spent wisely? Because if the only way government can function is by squeezing homeowners for every last dime, maybe the problem isn't Amendment 3. Maybe it's how we're managing the money in the first place.

Florida is going to become unlivable for young ppl. It’s gonna be a retirement community with theme parks. Reducing taxes this extremely basically reduces almost all basic services. Insurance costs will📈. Depending on the Federal Government 📈. This is a terrible idea.
2
1
210
BELMONT RACE 5
ENERGY 5
ENERGY has declared an EARLY variegate, and the 3 has apparently decided that the opening fractions belong to him. With a perfect 0.000 EMUV, Paragon A honors, and the Energizer designation, the 3 establishes himself as the dominant early contender. However, the 6 has other plans, securing Paragon B with the lowest sustained deficiency (0.241) and overall UXR (0.483). More importantly, the 6 owns a third-fraction velocity of 33.86 compared to the 3's rapidly deteriorating 31.57. The 3 may control the opening proceedings, but if that early advantage comes at the expense of finishing energy, the 6 could be arriving in deep stretch with a warrant for his arrest.

1
95
Belmont Race 8
Synergism!!
The 10 has the best early pace and the worst turn time, so if the 2 comes knocking on the bend, somebody tell those cheeks the complimentary portion of the trip is over. The 11 is my pick with top ranks in FW, SP, turn time and FX, while the 2 sits second in EP, SP, turn time and FX and looks well placed to make the 10 earn it. The 3 brings the best late pace and shares top DR, so I’ll close the card 11–2 to get the pick 5 home on the savor ticket!!

1
1
135
Belmont Race 7
Entropy’s deceleration graph gives us a KGEN-style view of how each horse holds up as the race unfolds. The 3’s yellow line towers over the field early, then drops through the pack around six furlongs and falls away sharply. The 5’s red line holds up best late, with the 2’s green line next on the graph.
let's see if we read this race correctly!!

1
1
144
Belmont Race 7
The 3 can have the first two fractions, but if somebody makes him work for both, that ass might be dead to rights by the eighth pole. I lean 5 in an S/P Presser matchup because ENERGY gives him both Paragon B and Energizer, though the 2 has the best third fraction and tops Entropy’s last three columns. The 1 gets Paragon A and the lowest uXr by a whisker, so I’m 5–2–1.

91
Belmont Race 6
ENTROPY
The 8 has the best early number and might even get comfortable up front, but the finish line is a little farther down the track. The 3 and 7 are the only two above all five Entropy pars, and I give the 3 the edge because it leads in all three right-hand columns. The 5 clears four of five and rounds out my 3–7–5.

3
154
