
Professor of Space Plasma Physics, amongst other things. Views always my own.
- Tweets106
- Following215
- Followers249
- Likes338




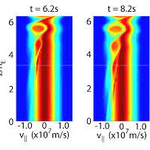



ALT Two graphics showing numerical simulation results where Alfven waves interact with electrons in space plasma. Electron trapping is clearly seen towards the top of the images. From Watt and Rankin, Physical Review Letters, 2009


ALT Multi-panel figure showing six panels with probability distribution functions. Each panel shows an ensemble result for numerical diffusion experiments using Dαα(L* = 3). Each panel shows a column-normalised probability distribution function for the phase space density f just outside the loss-cone αLC for (A) Δt = 2 min, (B) Δt = 10 min, (C) Δt = 30 min, (D) Δt = 2 h, (E) Δt = 4 h, and (F) Δt = 6 h. Note that each histogram is displayed using the same vertical binning, giving the histograms a pixelated appearance. Panel a, with the shortest time integration time shows the clearest relationship between diffusion time and phase space density, whereas a timescale of 6 hours produces the least clear relationship. Increasing the integration timescale clearly decreases the probability distribution function peak.


