

Technical market analyst | High quality charts | Long Term Investor | Free Market Economist | Masters in Business | Not financial advice
Joined December 2023
- Tweets10.3K
- Following1.1K
- Followers6.3K
- Likes542







Pinned Tweet
Welcome to Chart Wave Investing
Our passion is combining fundamental analysis with technical charts to give you a complete picture of what you are buying and when the best time may be to do so. We launched our substack, where you'll find:
• The Sunday Market Pulse - Our weekly newsletter going over all things stock market for the upcoming week
• Deep Dives - Fundamental and technical analysis for stocks
• Earnings recap - quarterly earnings highlights with technical analysis
• Educational content
It is all 100% free. | chartwaveinvesting.substack.…
$LMND earnings highlights and technical analysis

$IREN earnings highlights with technical analysis

$MU
October 19th we posted that if we were to see more downside the target would be the 0.5 fib level
It doesn't get any cleaner than that
See chart below 🎯🎯🎯


$MU
Stock prices are forward looking, especially in growth names. The price proved in these impressive earnings, and now price has stalled and has entered a correction
We are looking to see how price reacts at the weekly 50WMA, and if that fails we will be looking for price to test the 0.5 fib level and the 50SMA


In our Short-Term Forecast section on last weeks Market Pulse, we clearly laid out where we suspected the next pullback target to be, which was the daily 200SMA (blue line) and the 0.382 fib level.
Well...that is exactly what happened (see chart below)🎯🎯🎯
Understanding the technicals and what the chart is telling you is a huge part of our investment system.
$SPY $QQQ $IWM $ES_F $SPX


Very important in current market environments to know what you own
Reason being is that it gives you the confidence and clarity to block out the noise and remain disciplined in your holdings and positions.
$SPY
Chart Wave Investing retweeted

New multi-year contracts. Disciplined capital allocation. Flexibility to set our own pace of growth. Value at every layer of the platform.
Last quarter, AI Cloud revenue nearly tripled to $200 million.
Other highlights from our Q1 FY27 results:
- Total quarterly revenue increased 66% sequentially to $228 million
- AI Cloud quarterly revenue increased 182% sequentially to $200 million
- AI Cloud segment gross margin of 86%, in line with prior quarter
- Revenue backlog increased 22% sequentially to $20.3 billion; approximately two-thirds with investment-grade counterparties
- More than $4 billion ARR target is fully contracted and fully funded
- Expanded contract with Leading Frontier AI Lab post-quarter end
Listen to our conference call at 5:00 p.m. ET today: edge.media-server.com/mmc/p/…
Read more: iren.gcs-web.com/static-file…

Nasty selloff today. This short term price action that we are currently experiencing was forecasted and explained why in our newsletter.
This has come by no surprise to us. Understanding the technicals allows you to be prepared when catalysts happen and have an edge in understanding as to where price action is likely to go.
$SPY
$QQQ

Chart Wave Investing retweeted
$BE
TTM look promising. Dilution is typically a factor in high growth, capital intensive industries, but the fact the net income, revenue, and FCF are overall trending positive, this is the fundamentals that is needed to survive the current narrative and negative sentiment going around the current AI trade
$BE also sits in a unique position where they can provide power in such a short amount of time, which is a massive advantage in the current data center sentiment where delays and approvals are likely to be present in the construction process.
With that said, we are eyes on the $BE chart. Currently, with the rejection of the weekly 50WMA, we are looking at a potential ABC correction that will want to test the weekly 200WMA.
Out strategy is to likely start a small position under $200, and DCA as we make our way down, if that happens. If we hit the 200WMA, or 0.786 and find support, this is where we will size up our position substantially. But current market environment is likely to bring down all names associated with data centers and/or neoclouds. If those names can withstand the negative sentiment, then we can potentially see a strong rally as investors will be betting on the massive demand for compute to ultimately outweighs the short-term negative FCF and financing struggles.


$RSP putting in all-time highs while a lot of tech is in a bear market
This market continues to be resilient and capital stays at work in different sectors
So far, early reporting of earnings are looking solid
$LMND
$LMND
Earnings before the open and this is what we are looking for...
•Revenue to be $323–$326 million
•Adjusted EBITDA to be (20)-(23) million and on pace for first positive adjusted EBITDA for Q4
•In-force premium to be around +30% YoY
•Stable or improved vs. Q2 (~60%) gross loss ratio
The technical chart is one of our favorite setups in the market and this has been slowly becoming one of our larger positions.


$LMND
Earnings before the open and this is what we are looking for...
•Revenue to be $323–$326 million
•Adjusted EBITDA to be (20)-(23) million and on pace for first positive adjusted EBITDA for Q4
•In-force premium to be around +30% YoY
•Stable or improved vs. Q2 (~60%) gross loss ratio
The technical chart is one of our favorite setups in the market and this has been slowly becoming one of our larger positions.
$MU
After price first rejected the 0.618/0.786 zone, we knew we were still in a corrective structure
Now that price has lost the weekly 50WMA, there is an even stronger case that we are in Wave C, of our ABC correction, and price is likely to test the 0.5 fib level where the weekly 50SMA awaits.
With a P/E ratio (TTM) of 11.23, and coming off records earnings while memory continues to be a bottleneck, there is likely a lot of tailwinds and runway for this one still. $MU sits in a position where demand is likely to outpace supply through 2027 and 2028.
If the AI trade regains its way and investors turn risk-on, while $MU completes its correction, they sit in a strong position to have another campaign towards higher prices

$AMZN
Despite an initial negative reaction post earnings, price has rallied and is holding the channel

$SOFI
Still having strong confluence at the 0.618 fib level and bullish divergence on the weekly RSI

$AMD earnings highlights with technical analysis

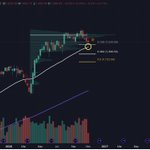
The yellow circle shows the importance of the lower wick we are currently seeing
The weekly chart, the 50WMA is currently acting as resistance, and for the daily its the 200WMA. There are algo indicators that trade off these levels, but more importantly, they are psychological levels.
We made it very clear in our Market Pulse that we expected price to violate these key levels and test the 0.382 fib level, in the process, we would be experiencing a ton of volatility.
So far, everything is playing out as expected, but we are still remaining cautiously bullish

