

Reaching financial freedom … one chart at a time 📈🌱 NFA
California, USA
Joined July 2025
- Tweets4.8K
- Following463
- Followers6.7K
- Likes10.8K





Would love to celebrate, but it would be naïve and far too early for that.
Yesterday was not necessarily a durable low similar to the several I've called in the past.
Not every bottoming signal I want is firing off simultaneously. There are a few of note however, promising relief we are seeing for now. This includes Candle-Based data, the Put/Call Ratio, and NASDAQ Summation Index reading.
Any bounce here will take far more work to prove its worth. Intraday can get rough if the greater powers will it. But I’d welcome the opposite occurring early as I’ve been starting to deploy cash in anticipation of a relief in the momentum basket.

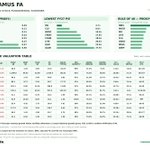
Fundamental Analysis snapshot on names of interest as near a bounce point.
Valuations are becoming more desirable on a long-term basis day-by-day.
Lots of noise from a macro perspective. Despite it, we’ve seen a strong earnings season thus far outside the Magnificent 7.

$SPX $ES_F
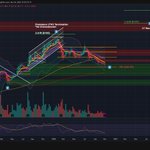
It is now testing the Daily 200MA as it enters the Weekly BOB, an area that shares conference of the 1.272 Log Fib off March lows alongside June/July lows.
This means downside risk from current levels may be contained to 1-2%. However, Volatility is elevated meaning flushes can be rapid and extreme.
Breaking below $7220 is a Red Flag. Would indicate a round trip to test massive consolidation built in the $6900-$7000 area. Personally do not see that happening, but as mentioned earlier, with Volatility elevated, anything is possible in the coming days as we search for a local low.
——————
$QQQ
Weekly candle is now stretched far below the Lower Bollinger Band and has broken below July lows to enforce potential SMT Bullish Divergence with the S&P 500.
The odds for a snapback rally are becoming quite high as Wave 4 comes to an end after its 15% correction off ATHs.
Downside risk here is an additional 3-5% corrective move over the coming days to backtest 2025 consolidation. Not too bad honestly. Tail end is here - if I’m wrong, then I’d be shocked and it may be signaling a Dotcom Burst level event.


Took long enough…

Broader Market Breakdown 🟡 Exercising Caution
In my view, the market may soon enter a corrective period as several macroeconomic flashpoints demand resolution. Not necessarily a major top, but a painful drawdown at least. The administration’s push on trade disputes and military efforts has created unease and persistent inflationary pressure. Strong technology earnings have helped keep GDP and the indices resilient despite the 10Y Treasury Yield approaching 5%, but concerns that AI development could intentionally slow down over safety considerations may dampen spending efforts.
AI leaders have driven a significant share of economic growth. Any significant slowdown could expose the broader cracks in the economy that are obvious under the surface. Valuation multiples would compress in the event that earnings struggle to keep pace with elevated yields and persistent inflation. This is why rate hikes have become base case, with one appearing likely this week and another possible before year-end. We may be entering a renewed tightening cycle, a circumstance that would bode poorly for risk-adjacent assets.
At this time, I am closely monitoring $SPX $ES_F for signs of a breakdown. It currently trades within a falling wedge into comfortable support, a bullish pattern until further notice. The key pivots outlined include $7625 / $7490 / $7220 with the Volume POC in the $7400s as well due to June-July consolidation. The cause for concern does not stem from this chart. Instead, it comes from a few other sources. I will discuss all of those below.
HY-Credit Spreads
➯ At this time, the chart is extremely tight, with Bollingers foreboding an explosive move approaching based on the signs of it being at all-time lows and RSI Bullish Divergence starting to build up. With Yields and rates rising, the risk of defaults only rises. The macroeconomic environment would suggest; therefore, that HY-Credit Spreads are bound to rise. This typically occurs during corrections as observed in previous ascents on the chart.
Volatility Index ($VIX)
➯ Similar to the credit spreads chart, the $VIX is also showing extremely tightened Bollingers and Bullish Divergence on higher timeframes. It is attempting a breakout from its downtrend as well, but is being repeatedly snuffed. Eventually, the dam will break. The key levels to watch for are 20 / 25 / 29 once it starts to rise.
$IWM $SMH $XLK
➯ At this time, all of these technology and high-beta related charts are showing me that they've marked a Wave 3 Top and are in a Wave 4 correction that is not yet sufficient enough of a drawdown or complete. That is why many names of interest are currently in the trenches and not tracking indices as well as they have before. Certain baskets such as energy and software tell a different story. It is also of note that $RSP has marked a major top based on my work so breadth should begin to deteriorate here.


$7220-$7340 on $SPX $ES_F is my ideal target range for a Major Low if the bleed is carried forward into tomorrow and early next week.
As for $QQQ, we’ve already reached the $661 target with ease with $626 being Bear Case. This comes as $MTUM is now stretched very low alongside $SOXX $SMH.
The snapback setup is guaranteed next week if we observe weakness tomorrow. I am praying for it. Sure we could bottom out today, but it’s just easier to deploy cash with confidence tomorrow depending on the Weekly/Daily candles.
Okay. Shocked to wake up to this if I am being honest.
Yes, I expected that the Major Low was not in yet, leaning towards next week as of yesterday. but did not foresee we would reach it in this manner. Horrible. Just horrible.
I guess I am fortunate I only own a single position and am still 80% cash. I do want to deploy funds right now, but my gut tells me to wait until tomorrow. So I compromised a bit and deployed a bit, moving the needle to 50-60% cash a bit ago.

I’ve seen countless posts on my timeline attempting to call a Major Low for this correction. Time after time they’ve been proven wrong and only a select few have acknowledged their mistake.
Timing is everything. Being a week early will lead you to the slaughter.
We’ve now sliced through the Key Level of $7490 on $SPX $ES_F with ease, unlocking the Bear Case outcome of retracing towards $7200s. An additional -3% from current levels. Not guaranteed though. It’s just that the window to reach that low has opened.
That said, I am not concerned at this time as I am underexposed and find that the next two days will be the most Bears can muster. This is their chance to push the gas. I will heavily consider purchasing equity in names either EOD tomorrow or early Thursday once the dust settles. Of course, I’ll provide timely updates if anything changes. It’s time to lock in.
Be careful with who you trust on this platform. Rose-tinted glasses are all too common here.
$NBIS
If unable to hold $135 here, keep your eyes on $123 // $110 // $102 as the few Key Levels to stake an entry or DCA.
The lowest of those levels has remained my Bear Case outcome. Starting to test those levels would indicate that the stock has been trading within LT Wave 2 since June, failing to activate the final extension of LT Wave 1 through Primary Wave 5. This is why I always sell at MW3/PW3 Tops. I prefer not to risk the chance of failure, inducing premature termination of upside moves.
Theoretically, in this Bear Case, the stock would head towards $600+ for LT Wave 3 long-term so it's not worrisome regardless of outcome as we approach desirable prices to long the name. But as always, the company must stick to the plan and execute to achieve the positive price action path outlined.
$NBIS
At this time, Nebius trades within Minor Wave 4 of Primary Wave 5, a corrective phase that has been unfolding since the June Local Top I pinpointed then.
The stock has since developed a relatively clean ABC corrective structure. The question now is how deep the ongoing C-Wave of MW4 wants to go? There are a couple outcomes if the count shown stands...
➯ Bring us down towards ~$135
➯ Running Flat ABC correction, establishing a local bottom around current levels
Each will eventually see us advance towards my ~$400 PT to complete Primary Wave 5. This would mark the finale of its initial long-term impulsive cycle, establishing the LT Wave 1 Major Top.
Conversely, a decisive loss of the mid-$130s would raise the possibility that PW5 + LTW1 have already terminated prematurely. Should this scenario materialize, I will reassess the wave structure and adjust my chart accordingly. That said, substantial structural support remains between $100–$120, which could provide a compelling long-term accumulation zone should the correction extend further.

I view this as a signal to inverse. Great catalyst to induce the potential final flush.
A Local Low for both Semiconductors and the Momentum basket has strong odds of arriving next week based on my findings today. It requires confirmation with the close on Friday though.

The regime shift means it’s going to be very easy for investors to get burnt applying frameworks that worked for the first part of the cycle to the next.
Our 10th State of the Themes is about how we intend to avoid that.
citriniresearch.com/p/state-…

$SOFI
With $XLF achieving all-time highs today, it may ready for its next leg higher. The question is whether SoFi will participate in this upside this time around. After a strong ER and a Weekly Engulfing Candlestick last week, it may be ready to reverse course and enter LT Wave 3.
This comes as it found support off the .618 Log Fib S&R ($13.65) and nearly tested its Weekly 200MA. Also, RSI Bullish Divergence is built on the Weekly charts. A year-long correction should be over soon if market makers want it. Just a matter of time.
The goal here is a Base Breakout above $20 that will launch the stock and enforce positive price action over a longer period of time. LT Wave 3 has a PT of $65+ at this time as Base Case.
Downside risk is low $10s. Losing the Weekly 100MA + .618 Log Fib ($13.65) will lead to this.


$LMND
With its ER tomorrow morning and after experiencing strong upside today, there is promise here. Lemonade may finally be finished with its LT Wave 4 correction with the momentum unwind approaching its end potentially next week.
It invalidated entering the overextension Bull Case of LT Wave 3 due to being victim to both the Software and Momentum unwind, but the LT Wave 4 Bear Case is fortunately already here. It has found support off the .786 Fib ($40) to bounce respectably thus far.
This comes as it enters a pocket of Weekly BOBs and Volume-Based support. All while RSI Bullish Divergence builds on the Daily/Bi-Daily chart. With a strong ER tomorrow, it can start a nice reversal to kickstart LT Wave 5, a move with a PT of $179+.
Downside risk is a visit to the Weekly 200MA at $35.

$NFLX
Its LT Wave 4 has been an impressively lengthy correction lasting 16 months. It is finding support off the .618 Fib ($61) for now as it clearly builds RSI Bullish Divergence on the Weekly chart.
The currently Weekly candle is a Bullish Engulfing Candlestick that could indicate the recent low may stand as a Major Low and reversal is inbound. If so, LT Wave 5 would begin, taking the stock towards a PT of $170+. However, downside risk is still there long-term.
If attempt at recovery is snuffed once more, I find that the Key Levels to monitor as Bear Case are $51 // $44. These act as the BTFD levels. It is where confluence is strongest.

$MTUM (Momentum Basket)
This is the basket that is effectively the main culprit behind the crash in retail-favorite names since June. Representative of the pain experienced, it has seen a -21% drawdown over the past 5 months for a clean ABC correction.
Not even the July 2024 or March 2026 corrections saw this severe of a drawdown. The April 2025 crash experienced a -25% drawdown on $MTUM so we are in that ballpark! Crazy to think about.
The Weekly candle for $MTUM is now stretched significantly below its Lower Bollinger Band as it approaches its Weekly 100MA. This opens the door for a snapback rally and potential V-shaped recovery similar to times past. The images below show 4 similar cases to the current setup since 2023. Each put in a Major Low.
The Bear Case is displayed in Image #4. A full-on Bear Market that led to a -33% drawdown on $MTUM in 2022. Personally, I do not see this happening. The economy may be in bad shape, but it is not nearly as severe as it way back then when inflation ran at 9.1% YoY with a massive, expedited rate hiking cycle. Also, AI advancement is firing on all cylinders unlike back then.


Reeks of capitulation today. For the AI trade specifically. Perhaps it becomes a multi-day event as the FUD machine spins its wheels, but sentiment is approaching the gutter. These are the kinds of catalysts that typically precede lows.
Countless individual charts are setting up for relief on the Daily chart. All in unison as corrections reach adequate levels for Major Low across many names.
This relief, of course, will only arrive if liquidity will allow it in the coming days to weeks. Otherwise these companies will remain a collection of falling knives while the ex-AI pockets of the market thrive. Unless today is a one-off and the market wants to reject off resistance above to tank towards Bear Case levels I’ve mentioned before on indices.
There are a few ex-AI names that have an enticing setup. I will share a look at those later today.
At this point … are we already trading within a 24/5 market? This is nuts.
Overnights have started to become increasingly meaningful over the past year. I will be closely monitoring $VIX intraday. It has been crushed for now, throwing a key part of my plan out of the window.
Not sure if this reversal stands, but the only action I took was building my position for $CLS when it was -5% overnight. Not too shabby.
Could I regret not doing more? Perhaps, but I do not think I will if we fail to achieve the $VIX spike and immense downside I’d hoped for over the next day or so. It ruins the setup for a stronger relief bounce and opens the door to a more lengthy corrective period.


Markets are all over the place. Excited to see how everything shakes out intraday tomorrow. Overnight price action could be a warning sign. If not, oh well.
The masses spoke their mind loudly today. An election representative of ill will towards the ongoing war, tariffs, and their ramifications on our day-to-day lives.
Perhaps this “Blue Tsunami” pushes the administration towards a more restrained, diplomatic approach in the conflict against Iran. Excessive military action without congressional authorization, similar to months past, will now carry significant political consequences, impeachment included.
The political influence of Trump and the MAGA movement is clearly starting to fracture overnight. Senate Republicans may start to push back moving forward rather than toeing the line, distancing themselves from the administration to protect their electoral futures.
This would mean that, in an impeachment scenario, the door is open to enough Independent and Republican support for conviction and removal from office as the Republican Party must carve out a new identity out of desperation for 2028. Food for thought. A strike on Iran may no longer in the cards for Trump and his administration. Interesting times.
I’ve seen countless posts on my timeline attempting to call a Major Low for this correction. Time after time they’ve been proven wrong and only a select few have acknowledged their mistake.
Timing is everything. Being a week early will lead you to the slaughter.
We’ve now sliced through the Key Level of $7490 on $SPX $ES_F with ease, unlocking the Bear Case outcome of retracing towards $7200s. An additional -3% from current levels. Not guaranteed though. It’s just that the window to reach that low has opened.
That said, I am not concerned at this time as I am underexposed and find that the next two days will be the most Bears can muster. This is their chance to push the gas. I will heavily consider purchasing equity in names either EOD tomorrow or early Thursday once the dust settles. Of course, I’ll provide timely updates if anything changes. It’s time to lock in.
Be careful with who you trust on this platform. Rose-tinted glasses are all too common here.

Amazing! Love seeing futures flip red.
I’m stubborn. I want a definitive bottom that we can confidently capitalize on.
If the market either closes red or flushes severely over the next day or so, we should finally see the opportunity to accumulate positions of interests at ideal levels.

$SPX $SMH $VIX
Evidence for a local low approaching on the candle-based data side is increasing on the tickers listed. Depending on tomorrow, the Volatility Index may be signaling that the bottom may come as early as the end of this week.
Do note that this outcome would require downside tomorrow. Keep your eyes on the Key Level of $7490 on $SPX $ES_F. I would strongly consider exposing myself more heavily if it came tomorrow or we even spilled far past it. At that point, I estimate we would stretch ourselves too low, facilitating a snapback.
From the low carved out, if it occurs, it then becomes a question of how far Bulls will be able to take us.
It must be noted that Oscillators, Put/Call Ratios, and Stocks Above data points are not in agreement of a full-on recovery yet. This means a more extended bounce leans towards temporary relief ahead of more pain to come.


