

Earth Insights for a Changing Planet.
Joined March 2016
- Tweets79
- Following265
- Followers1.1K
- Likes104




Climate Engine retweeted

With serious ARs barreling down on us, its time for a reminder of this nifty tool from the folks @CW3E_Scripps: For every watershed on the map you can call up current forecasts of snow vs rain fractions & amounts from GEFS ensembles.
Be safe out there!
cw3e.ucsd.edu/DSMaps/DS_free…

Climate Engine retweeted

Powered by Google Cloud’s geospatial & data analytics technologies, @SCJohnson OFF!Cast Mosquito Forecast is the first technology platform that provides the public with free & accurate mosquito forecasts, a critical asset in disease prevention. fastcompany.com/90748977/thi…

Climate Engine retweeted

I am happy to announce that we launched the #mosquito forecast with @SCJohnson, @googlecloud, and @ClimateEngine! It was a privilege and great pleasure to work with the entomologist Dr. Maude Meier. Here to more from #EarthEngine #Commercial
cloud.google.com/blog/produc…

Climate Engine retweeted

With Google Cloud, @ClimateEngine fuses Earth and economic data to help organizations forecast drought conditions along the supply chain, determine wildfire risk and more.
Read more of our work with partners to create sustainability tools → goo.gle/3JRoQMl #EarthWeek
Climate Engine retweeted
Great webinars earlier this week led by @aj_mccullum @NASAARSET . It was great to see @ClimateEngine was used in full swing 📊📈🌎

This Post is from an account that no longer exists. Learn more
Climate Engine retweeted

As a @googlecloud Partner and Google Cloud Marketplace solution provider, @ClimateEngine will provide a commercial conduit for GHGSat's data to customers in a variety of sectors worldwide.🛰️🌎 ghgsat.com/en/newsroom/metha…

Climate Engine retweeted

BIG Water News: #OpenET, a new online platform that uses satellites to estimate water consumed by crops, launched today, making critical data for water management widely available in 17 western states amid record #drought. #ValueWater openetdata.org

Climate Engine retweeted
"The time for businesses to act on climate is now.... To make sure businesses can make the most out of Google Earth Engine, we’re working with partners, like NGIS and @ClimateEngine, to help businesses identify and manage risks related to climate change." blog.google/products/earth/e…

Climate Engine retweeted

New @googleearth #EarthEngine App to make #Landsat satellite image time-lapse vids yourself anywhere on #Earth. Imagery is cloud-free and smoothed using LandTrendr algorithm. The results are powerful demonstrations of landscape change. #scicomm
👉emaprlab.users.earthengine.a…
Climate Engine retweeted

Chris Pearson is here demonstrating the power of @climate_engine—an app developed by DRI & @uidaho—to map climate & satellite data and visualize historical changes in precipitation, vegetation, & more. #DiscoverDRI #NVLeg

Climate Engine retweeted

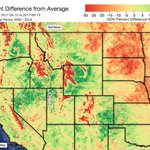
What can vegetation conditions tell us about #drought and precipitation trends in the conterminous United States? Here’s what our VegDRI and QuickDRI maps say this week. See the change week-to-week by following this link: vegdri.cr.usgs.gov/

Climate Engine retweeted

Our new study in PNAS (@PNASNews) assesses how natural and human-modified watersheds are reacting to recent climate change. Check it out! Open access!
Co-authors: @climate_guy @indianaclimate @JasonKnouft
and, absent from Twitter, Sarah Null.
pnas.org/content/early/2018/…

Climate Engine retweeted

Using cloud-based remote sensing and climate data to assess riparian restoration efforts using @climate_engine @watermapper @hydromet_man sciencedirect.com/science/ar…

Climate Engine retweeted

In next week's CA-NV #webinar, Dan McEvoy @hydromet_man will present the #drought & #climate update/outlook. Dr. McEvoy is a regional climatologist with @WRCCclimate @ @DRIScience & is one of the folks at @climate_engine.
For info & to register: drought.gov/drought/calendar…

Climate Engine retweeted
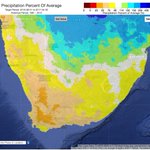
But wait, there's more! @climate_engine also global data sets - check out this map created in #ClimateEngine using #data from @NASA's MERRA-2 showing total precip % of average (1981-2010) for Jan-Mar 2018. Dark browns in northern Mexico show many places at 5-25% of normal


Climate Engine retweeted
This map created in @climate_engine shows the % of average precip for March 1-17 across the western half of the lower 48. Heavy precip and #snow helped mitigate #snowdrought in CA & NV, while little to no precip intensified #drought in the Southern Plains

Climate Engine retweeted
With the #drought expanding across the Southern Plains, it's a good time to check out what kind of #data @climate_engine can visualize. This SPI* map shows how precipitation has deviated from mean levels across the Plains. Blue = wet, red = dry
*Standardized Precipitation Index

Climate Engine retweeted
Did you know you can use @climate_engine to see #EDDI #data?
High #Evaporative Demand (thirst of the atmosphere) over #California & the #Southwest indicates warm & dry conditions, which can drive #snowdrought
EDDI #drought colors correspond w/ US #DroughtMonitor classes

Climate Engine retweeted

#TriviaTuesday #Landsat was used in 1976 to make this first color mosaic of the 48 contiguous United States for @NatGeo go.usa.gov/xnU23
