

Crypto Trader / Free Alpha Provider Pay attention dyor
USA
Joined August 2021
- Tweets421
- Following630
- Followers82
- Likes1.7K


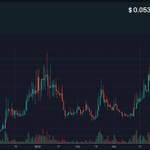
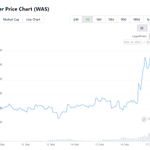


#BullishOnAutos !!!!!

2nd attempt
GIVE AWAY
$1000 in $AUTOS
I'll pick 2 lucky winners tomorrow at 12, who did the following:
* follow me
* follow @CryptoAutos_
* retweet this post with #BullishOnAutos
CosmoKrypto retweeted

2nd attempt
GIVE AWAY
$1000 in $AUTOS
I'll pick 2 lucky winners tomorrow at 12, who did the following:
* follow me
* follow @CryptoAutos_
* retweet this post with #BullishOnAutos
Love your work @Anbessa100
If you have time can you use your talent and take a look at the chart of $VET? TYVM!
CosmoKrypto retweeted

Update on $BTC the objective truth.
Market Outlook:
The current market outlook for Bitcoin suggests that it has undergone several phases of support, rebound, retracement, and re-accumulation. The recent ignition brought the price to around $30,100, and it is currently trading at $28,372.79. The short-term trend is strongly positive, with various technical indicators showing bullish momentum.
Bitcoin has broken through key resistance levels and has a bullish near-term outlook. However, the medium and long-term trends remain less certain, with the medium term being described as "Neutral" and the long term as "Downtrend."
If, however, a bearish breakout occurs below $24,900, it is likely to lead to a decline towards $21,600-23,800. A price alert is advised to monitor this breakdown.
Current Price and Trends:
The current Bitcoin price is $28,372.79, down -0.34% in the last 24 hours but up 3.56% in the last 7 days.
It is down -58.88% from its all-time high (ATH) of $69,003.94 from November 10, 2021, and down 10.80% from the 52-week high of $31,808.86.
The short-term trend is described as "Strong Up," the medium-term trend is "Neutral," and the long-term trend is "Strong Down."
Near-term momentum is considered "Bullish" based on both MACD and RSI indicators.
The RSI (Relative Strength Index) indicates that the price is neither overbought nor oversold at the moment.
Please hit the 'like' button and share this post.


Update on $BTC. Lower - Mid Term.
Added context to the picture, and removed unnecessary information.
Please like and retweet if you find the content helpful.
Please leave your questions in the comments - there is no wrong question!

CosmoKrypto retweeted

Fuck it giving away $1,000 cash. Follow @OverDogsPodcast and rt for a chance to win. Will pay in 72 hrs.

CosmoKrypto retweeted
What was happening the last time MACD and PA looked like this on the weekly?
Read below.
1/ On August 19th, 2019, the global economic landscape was marked by significant events that had far-reaching implications. 🌍 Here's a recap of what happened and why it mattered. #EconomicSnapshot
2/ U.S.-China Trade Tensions soared to new heights, escalating the ongoing trade dispute between the two economic giants. This had a profound impact on global markets throughout 2019, generating waves of uncertainty among investors. #TradeWar
3/ The Yield Curve Inversion grabbed headlines, raising concerns about a potential economic recession. When short-term interest rates surpass long-term rates, it often signals trouble ahead. On August 19th, this inversion deepened worries about the state of the global economy. #YieldCurve
4/ Stock Market Volatility roiled markets on August 19th, 2019. Major indices like the DJIA, S&P 500, and Nasdaq experienced declines, reflecting investor unease. The trade tensions and yield curve inversion fueled market uncertainty and heightened anxieties. #MarketVolatility
5/ Global Economic Concerns loomed large on August 19th, 2019. Slowing growth in economies like Germany and China added to worries already fueled by trade tensions and yield curve inversion. This turbulent environment left investors on edge, with uncertainty prevailing. #GlobalEconomy
6/ Corporate Earnings reports played a pivotal role on August 19th. Companies released their quarterly results, which often have a significant impact on stock prices and overall market sentiment. Investors closely watched these reports for insights into companies' financial health. #EarningsReports
7/ Federal Reserve Policy was under scrutiny. On August 19th, investors speculated about potential interest rate cuts as a response to economic uncertainties. Monetary policy changes can profoundly influence financial markets and investor sentiment. #FedPolicy
8/ Oil Price Fluctuations added to the volatility on August 19th. Geopolitical tensions and concerns about global demand drove fluctuations in oil markets. With implications for energy companies, transportation costs, and overall economic growth, oil prices were closely monitored. #OilMarket
9/ August 19th, 2019, was a pivotal day, marked by trade tensions, yield curve inversion, market volatility, economic concerns, earnings reports, Fed policy speculation, and oil price fluctuations. These events had a lasting impact on the global economic landscape. #GlobalEconomy2023


CosmoKrypto retweeted
My Point of view as it stands.
--------------------------------
It is likely that the market will consolidate in the next phase. Initially, the MACD signaled a bearish trend, but now it is showing signs of bullish inflection.
--------------------------------
Why?
--------------------------------
A consolidation phase is likely to follow an ABC corrective wave. Keep in mind that ABC corrective waves can sometimes be followed by more intricate corrective patterns.
--------------------------------
So keep this in mind!
--------------------------------
When the price reaches the midpoint between points A and B (often referred to as the 50% retracement level), it suggests that there is a balance or equilibrium between buyers and sellers.
Indicating a pause or consolidation before the price continues its movement in the direction of wave C.
--------------------------------
That being the case, what do you look for? Strength?
--------------------------------
In order to determine whether a price movement will continue or reverse from the midpoint, look for additional confirmation signals (Inflections and Divergence) with technical indicators.
Cycle throw HTF --> MTF --> LTF and read the momentum and how it is playing out.
⚠️These factors help to assess the strength and potential direction of the price action after the consolidation phase within the ABC corrective wave.⚠️


CosmoKrypto retweeted

Holy crap we have a lot of people waiting..
Okay, do me a big favor and retweet my latest video and I'll open up free access again next week for anyone that wants to join. Deal?
teapawt.net/Nebraskangooner/status…

🚨Why RSI Divergences Suck
The newest video in my @bitgetglobal YouTube series has arrived!
A breakdown of why RSI divergences are unreliable and how you can increase the effectiveness of this indicator while trading.
Watch it now or HFSP👇
youtu.be/lusM_8-0U7I
