






Pinned Tweet
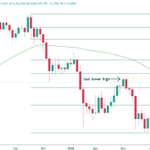
$BTC at a Critical Inflection Point 🧭
We’re measuring the retracement from the October 2025 high ($126k) down to the recent low.
Key Fib levels:
• 0.236 ($69.4k) → First resistance
• 0.382 ($77.7k) → Major hurdle
• $82.8k → Last significant lower high
• 0.5 ($85.2k) → Structure shift
The big debate:
Bear Thesis: This will just be a relief rally. We make one more lower high then roll over later this year (4-year cycle).
Bull Thesis: We break $82.8k, form a higher low, and shift the structure bullish.
Which side are you on? What level would change your view?
Not financial advice — manage risk.


chain-2:native — daily 50/200SMA bull cross is pending.
Last two times this setup printed:
• 2023 — price peaked -2 days before the cross
• 2024 — price peaked +2 days after the cross
Both times price corrected back to the 0.618. That dip was not the end of the move. It was the reset before continuation higher.
History doesn’t repeat. It often rhymes.
What I want to see now:
• Cross actually prints and holds
• Daily close back above the flattening 200 SMA
• Any shakeout into the 0.618 holds as support — same script as the last two
Invalidation: lose the higher-low structure and close back under ~$0.0032. Then this is just another bounce in a downtrend.
Speculative. Watching the cross — not front-running it.
Not financial advice.


$BTC update — the $85k level we marked as the structural shift is being tested in real time.
Weekly:
• Broken the lower high structure at $82,814
• Price back through the 0.236 and 0.382
• Sitting on the 0.5 Fib (~$85.3k)
• Weekly closed above the 50 SMA
This is the same ladder we laid out off the cycle low: $57.6 → $69.4k → $77.8k → $85.3k. Those boxes are ticked. It is not “to the moon just yet.” But it is the first weekly that starts to confirm the bull case.....
Next: hold a weekly close above $85k and confirm no 'lower lows' in Q4.
Many of us called it when it was unpopular
Not financial advice.


$BTC at a Critical Inflection Point 🧭
We’re measuring the retracement from the October 2025 high ($126k) down to the recent low.
Key Fib levels:
• 0.236 ($69.4k) → First resistance
• 0.382 ($77.7k) → Major hurdle
• $82.8k → Last significant lower high
• 0.5 ($85.2k) → Structure shift
The big debate:
Bear Thesis: This will just be a relief rally. We make one more lower high then roll over later this year (4-year cycle).
Bull Thesis: We break $82.8k, form a higher low, and shift the structure bullish.
Which side are you on? What level would change your view?
Not financial advice — manage risk.
$XCN — speculative weekly update
Price is still under the descending trendline from the Jan 2025 high. The weekly 20 SMA and 50 SMA are sitting on that same line. That cluster is resistance.
First confirmation: weekly close through the trendline / SMA cluster.
First real challenge after that: Closing above $0.0056 (0.236).
Then the path opens toward:
• $0.0085 (0.382)
• $0.0119 (0.5)
• $0.0166 (0.618)
Speculative case: the Nov 2024–Jan 2025 fractal shows a peak between the 1.272 and 1.414. Whether we see the same impulsive move or grinding into 2027/28, those remain my longer-term bullish targets.
Balanced case: no weekly close above the trendline / SMA cluster and this is still just another bounce. Lose the higher-low structure and slip back under $0.0032.
Not financial advice.

bitcoin:native Bears vs Bulls battle update:
From the Oct 2025 high to the low, the levels were:
• $69.4k (0.236) — cleared✅
• $77.7k (0.382) — cleared ✅
• $81,097 (Weekly 50SMA) — in progress
• $82.8k — last major lower high
• $85.2k (0.5) — structure shift
The bear case was “relief rally, then rollover.”
The bull case is strengthening but the bears still have a lifeline until we get weekly closes above the 50SMA and $82.8k breaks and holds.
Not financial advice.

$BTC at a Critical Inflection Point 🧭
We’re measuring the retracement from the October 2025 high ($126k) down to the recent low.
Key Fib levels:
• 0.236 ($69.4k) → First resistance
• 0.382 ($77.7k) → Major hurdle
• $82.8k → Last significant lower high
• 0.5 ($85.2k) → Structure shift
The big debate:
Bear Thesis: This will just be a relief rally. We make one more lower high then roll over later this year (4-year cycle).
Bull Thesis: We break $82.8k, form a higher low, and shift the structure bullish.
Which side are you on? What level would change your view?
Not financial advice — manage risk.
$XDC weekly update.
The bottoming structure I’ve been watching is still intact.
// Weekly Hull still bullish.
// Weekly RSI bullish divergence from the lows is playing out
Price is holding the base. Next confirmation I want to see is a break of weekly 20 SMA resistance this week or next. That would shift this from “base forming” to “bullish continuation.”
Not financial advice — manage risk.
What are you seeing on XDC? 📊


$XDC Weekly Setup - looks bullish
Hull Indicator has flipped bullish on the weekly timeframe.
Back in November 2024 we saw a strong rally - just under 500% in 70 days.
However, last time we had a major catalyst (Trump's election victory). Right now we don’t have the same clear trigger.
History often rhymes, but without a catalyst this move may struggle to provide the same strength....
Still worth watching closely.
Not financial advice — manage risk.

$XDC Weekly follow up - more confluence
a Weekly bullish divergence forming — same setup that marked the late 2022 low before a major reversal.
Could this be signalling the low this cycle?
Next few weekly closes will tell us.
Watching closely.
Not financial advice.

$XDC Weekly Setup - looks bullish
Hull Indicator has flipped bullish on the weekly timeframe.
Back in November 2024 we saw a strong rally - just under 500% in 70 days.
However, last time we had a major catalyst (Trump's election victory). Right now we don’t have the same clear trigger.
History often rhymes, but without a catalyst this move may struggle to provide the same strength....
Still worth watching closely.
Not financial advice — manage risk.
$XDC Weekly Setup - looks bullish
Hull Indicator has flipped bullish on the weekly timeframe.
Back in November 2024 we saw a strong rally - just under 500% in 70 days.
However, last time we had a major catalyst (Trump's election victory). Right now we don’t have the same clear trigger.
History often rhymes, but without a catalyst this move may struggle to provide the same strength....
Still worth watching closely.
Not financial advice — manage risk.
$XCN Weekly Outlook
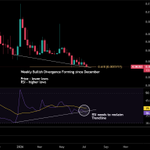
Zooming out - we can see that a bullish divergence has been building since December.
Key levels this week:
RSI: Reclaim 38 on the weekly
Price: Hold the support trendline and close above the 0.618 Fib
If both hold → very bullish setup for the coming weeks.
Lose both → we have to respect the possibility of lower prices.
Higher timeframe structure still in focus.
Not financial advice — manage risk.
What do you think about $XCN? 👇

$XCN 4H Update
A bullish divergence is starting to form on the 4-hour chart (lower lows in price, higher lows on RSI).
It’s not the strongest setup I’ve seen, but it’s worth watching while we’re in this bottoming phase. XCN has bounced hard from similar setups before.
Still respecting the macro 0.618 on higher timeframes as the key level.
Cautious here — waiting for confirmation.
Not financial advice — manage risk.
Thoughts on $XCN? 👇


$XCN 4H Update
A bullish divergence is starting to form on the 4-hour chart (lower lows in price, higher lows on RSI).
It’s not the strongest setup I’ve seen, but it’s worth watching while we’re in this bottoming phase. XCN has bounced hard from similar setups before.
Still respecting the macro 0.618 on higher timeframes as the key level.
Cautious here — waiting for confirmation.
Not financial advice — manage risk.
Thoughts on $XCN? 👇


Cooler CPI print = good for risk assets ✅
ETH/BTC breaking out of long-term resistance.
ETH on weekly showing strength — holding key support and pushing toward the descending trendline.
A close above $1,900–$1,950 this week would be very bullish and help build higher lows. Above the 0.236 even stronger.
This is the setup alts need.
Not financial advice — manage risk.


$BTC Weekly Structure Update
As all the bears have pointed out - the chart is starting to look eerily similar to 2022 and we are now just waiting for the lower low in October.
But for me the big question is: Are we repeating history perfectly because of "time", or will structure tell a different story this cycle?
Bear Case:
We fail to make a higher low, break the recent lows and make one final lower low in Q4 (classic 4-year cycle completion).
Bull Case:
We hold the structure, climb the fibs (0.236 / 0.382) and begin to form higher lows above $83k, invalidating the bearish thesis.
I’m watching the price very closely as we get into August - Mid August looks like it could be decision time on which direction this goes.
What are you seeing?
Not financial advice — manage risk.

$XCN Macro View
Zooming out, price has come down to perfectly test the macro 0.618 Fib level (drawn from the Oct 2023 low to the Jan 2025 high).
This key support has held since May.
As the broader market shows potential signs of bottoming, this $0.0035 area could mark the low.
Invalidation: Clean break and close below $0.003 could open the door to $0.0026 - $0.00246 (0.702 Fib)
Still watching closely for confirmation.
Not financial advice — manage risk.

Another positive development for @Onyx and chain-2:native
Constructive progress — another brick in the wall rather than a home run.
The team is methodically building the institutional story, which is what we ultimately want as holders for the higher targets.
What are your thoughts on this update??
This quoted post is unavailable.
$ETH / $BTC looking strong on the weekly.
Price holding above the long-term descending trendline with RSI approaching 50 and MACD forming a potential bullish cross.
A weekly close above 50 on the RSI + a confirmed MACD green cross would be very bullish for alt rotation.
Invalidation: No higher low on RSI + failed MACD cross this week.
Watching closely into the weekend.
Not financial advice — manage risk.

$VELO Setup Looking Strong
Daily breakout in progress + MACD bullish cross forming.
Daily RSI approaching 50 — a key level to confirm a bullish break
Patient swing setup with good risk/reward into the July/August window.
Invalidation: Loss of the $0.003 support level and failed MACD bullish cross.
Not financial advice — manage risk.

$TEL Price Target Update
Market structure remains constructive for a bullish July/August altcoin window.
Tel's last mini-run reached the 1.414 – 1.618 Fib zone. A similar move from here could target 10-15x.
A swing trade I’m willing to take.
Watching: Hull Indicator turning bullish - Weekly RSI pushing back above 50
Invalidation: Loss of higher low structure + close below $0.002
Not financial advice — manage risk.

