Dan Marrazza (@DanMarrazza) header
Dan Marrazza (@DanMarrazza) profile picture

Emmy winner, sports biz veteran & dad joke enthusiast. Formerly @ArizonaCoyotes, @ProFootballHOF, @DraftKings, @GoldenKnights. Looking for next opportunity.

Joined July 2011
Photo by Dan Marrazza (@DanMarrazza)Photo by Dan Marrazza (@DanMarrazza)Photo by Dan Marrazza (@DanMarrazza)Photo by Dan Marrazza (@DanMarrazza)Photo by Dan Marrazza (@DanMarrazza)Photo by Dan Marrazza (@DanMarrazza)Photo by Dan Marrazza (@DanMarrazza)Photo by Dan Marrazza (@DanMarrazza)Photo by Dan Marrazza (@DanMarrazza)Photo by Dan Marrazza (@DanMarrazza)
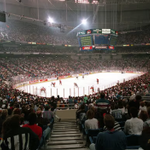
Trivia Before it was Tropicana Field, it had the best name ever for a major league sports venue: The Thunderdome. It was home to the @TBLightning from 1993-96. It still has the NHL record for the most people to ever attend a playoff game --28,183 against the Flyers in 1996.
Tropicana Field from center field before Game 4
38
126
8
1,684
142,284
Trivia The band Fountains of Wayne was formed in Wayne, NJ & was named after a store that used to sell actual fountains called Fountains of Wayne that was a well known local landmark. In The Sopranos, it’s the place where Tony Soprano, shopping, runs into the cop (Charles Dutton) he got fired for giving him a ticket.
fountains of wayne - stacy’s mom 2003
3
219
When analyzing social media data, context is important. Particularly as it relates to what content teams can control, as opposed to the size of the team's market or their win-loss record. Knowing that the @WNBA's popularity has skyrocketed this year, I created a chart featuring the TikTok performance of every @NBA & WNBA team, together, to put the WNBA's growth in context. Obviously, given the NBA's 50-year head start as a brand, many of its teams have way more followers & raw-total engagement numbers. However, when gauging performance relative to the size of the teams' platforms, WNBA teams mostly outperformed NBA teams by a clear margin. 𝐄𝐱𝐩𝐥𝐚𝐢𝐧𝐢𝐧𝐠 𝐓𝐡𝐢𝐬 𝐂𝐡𝐚𝐫𝐭 𝐗-𝐀𝐱𝐢𝐬/𝐇𝐨𝐫𝐢𝐳𝐨𝐧𝐭𝐚𝐥: Each team's regular-season winning percentage in 2026. 𝐘-𝐀𝐱𝐢𝐬/𝐕𝐞𝐫𝐭𝐢𝐜𝐚𝐥: Each team's median Exposure Rate for all of their TikToks in 2026. Exposure Rate measures how widely content is viewed relative to an account’s follower count -- a 20% Exposure Rate means a post received views equivalent to 20% of the account’s followers, making it easier to compare performance across accounts of different sizes without favoring those with larger audiences. The difference between Exposure Rate & Engagement Rate is that Engagement Rate weights every kind of engagement the same (even though platforms weigh them very differently) and doesn't take into account "silent scrollers" who, as the majority of the audience, consumes content & creates value but doesn't show up in engagement numbers. Exposure Rate offsets both of these things. Using medians instead of averages minimizes the influence of unusually viral posts, providing a more accurate picture of typical content performance. 𝐁𝐥𝐮𝐞 𝐒𝐪𝐮𝐚𝐫𝐞𝐬: NBA Teams 𝐎𝐫𝐚𝐧𝐠𝐞 𝐒𝐪𝐮𝐚𝐫𝐞𝐬: WNBA Teams 𝐓𝐡𝐞 𝐏𝐨𝐝𝐢𝐮𝐦 1. @DallasWings: 44% Exposure Rate (median) 2. @seattlestorm : 29% 3. @TempoBasketball : 28.5% 𝐇𝐨𝐧𝐨𝐫𝐚𝐛𝐥𝐞 𝐌𝐞𝐧𝐭𝐢𝐨𝐧 @ATLHawks: 10.4% (highest in NBA) 𝐎𝐯𝐞𝐫𝐚𝐥𝐥 𝐓𝐚𝐤𝐞𝐚𝐰𝐚𝐲 𝐎𝐯𝐞𝐫𝐚𝐥𝐥 𝐍𝐁𝐀 𝐄𝐱𝐩𝐨𝐬𝐮𝐫𝐞 𝐑𝐚𝐭𝐞: 2% 𝐎𝐯𝐞𝐫𝐚𝐥𝐥 𝐖𝐍𝐁𝐀 𝐄𝐱𝐩𝐨𝐬𝐮𝐫𝐞 𝐑𝐚𝐭𝐞: 8% Eight of the 15 WNBA teams exceeded the NBA's top-performing team, the Atlanta Hawks (10.407%), who themselves were five times higher than the average NBA team. For context, NBA team TikToks have a median of 2,800 engagements, compared to around 1,300 in the WNBA. This means that despite the WNBA outperforming the NBA by quite a bit compared to the size of their platforms, the NBA still has a distinct advantage in overall numbers. But the gap is shrinking. This isn't meant to pit one league against the other or say that one league is doing better or worse than the other. It more means that the growth of the WNBA is so pronounced that its content teams deserve a lot of credit. Hat tip to @mondometrics & @nickcicero for the data access that made these calculations possible!
1
434
I was at that one. It was my first time in Canada.
On this date in 1993: Joe Carter hits a three-run walk-off home run in Game 6 of the World Series, securing the Blue Jays' second consecutive title.
4
470
Fun Fact The iconic Addams Family House is based on a real location. Westfield, New Jersey
5
328
When it comes to marketing and social media, following a narrative is dangerous. Because narratives are often not based in fact. Following data can also be dangerous. Especially for teams, there's so much data out there that's dependent on the team's record and the size of their fan base, that can paint an inaccurate picture of how effective different pieces of content are on social media. In the @NHL, it's been widely publicized how the league's new generation of players -- Macklin Celebrini, Connor Bedard, the Hughes Brothers, etc. -- are the league's "TikTok" players. Thanks to data from @mondometrics /@nickcicero, I recently dove into the performance of every NHL team TikTok post in 2026, through October 20, to try to cut through the narrative and try to find what the data actually supports. For every NHL team, I first established their Median Exposure Rate for all of their TikTok posts. For 10 of the league's most popular players -- featuring both the younger wave of stars as well as some of the league's more established stars -- I then calculated the Median Exposure Rate for all of their team's posts "focusing" on them. By "focus" on them, I mean the player couldn't just be included in the post. He had to be the primary focus of the content. This allowed me to calculate how much of a percentage increase each player delivered compared to one of their team's Median posts, which essentially allowed players to be compared fairly, without their market size or overall success of their team's social media strategy skewing the results. Some of the results fit the narrative...Quinn Hughes of the @mnwild has been BY FAR the TikTok king of 2026. But the rest of the results didn't fit the narrative...the next four ranked players were all born before the year 2000. Sidney Crosby/@penguins and Alexander Ovechkin/@Capitals, born in the 80s, provided more of a boost for their teams than Macklin Celebrini and Connor Bedard, born in the 2000s. None of this is to suggest that the players who ranked lower on this chart aren't major draws on TikTok. All 10 players generated a measurable lift above their team's baseline, and they're among the biggest names in a league with more than 600 players. The bigger takeaway is what this type of analysis makes possible. By measuring the impact individual players have on content performance, teams can instead apply this analysis to all of their players on their own roster, rather than comparing superstars on different teams. This can help them make informed decisions about who to feature, how to build their content strategies, and where opportunities exist to turn audience interest into revenue. It's not about proving one superstar is more valuable than another. It's about understanding what actually resonates with an audience, rather than assuming we already know.
2
3
451
Revenge of the Nerds was released in theaters in 1984, taking place at the fictional Adams College. The University of Arizona was the real-life campus where the movie was filmed. Tucson, Arizona.
305
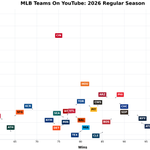
Last week I recapped @MLB team TikTok performance for the 2026 regular season, where the @Nationals, @Brewers and @Royals finished atop the proverbial podium for season-long performance. 𝐓𝐡𝐚𝐭 𝐏𝐨𝐬𝐭: bit.ly/4ieYS8X Today, I'm taking a similar approach to analyze every team's performance on YouTube this season, thanks to data provided by @mondometrics & @nickcicero. This time around, the Brewers remain on the podium, where they're joined by the @Reds, who each finished with nearly DOUBLE the median Exposure Rate of any other team in MLB. The shocker is that neither team shared a single YouTube Short the entire season -- they and the @RaysBaseball were the only teams that didn't feature YouTube Shorts as part of their strategy. While YouTube Shorts dominated results in 2025, in 2026, the two top performing teams were two of the few teams that didn't use YouTube Shorts at all. 𝐗-𝐀𝐱𝐢𝐬/𝐇𝐨𝐫𝐢𝐳𝐨𝐧𝐭𝐚𝐥: Each team's number of wins this season 𝐘-𝐀𝐱𝐢𝐬/𝐕𝐞𝐫𝐭𝐢𝐜𝐚𝐥: Each team's median Exposure Rate for all of their YouTube videos this season. The majority of "team rankings" shared by various providers fail to provide context around how many followers a team has, the impact of a team's record on its social performance and the tremendous skewing of results created by individual outlier posts. The goal of this graph structure is to both provide context on the impact of a team's win-loss record, as well as measuring performance with metrics that offsets the advantages that come from playing in a larger market and having more followers. The farther to the right the team is, the better their on-field records; the higher up on the vertical part of the chart, the better their Median post performance. Honorable mention to the @Rockies, who despite finishing last in on-field standings, cracked the top seven!
1
354
I checked. This was 8 seconds longer than Bartolo Colon 😅
Junior Caminero just had the second longest home run trot ever recorded at 38.66 seconds Beyond well deserved
9
953
Fun Fact This World Series joins the @Phillies-@Royals 1980 World Series as the only World Series to feature two teams who have never won one before in the last HUNDRED YEARS!
The World Series matchup is set! Either the Brewers or Rays will win their first championship 🏆
1
4
472
The @90sWWE fans out there may be able to appreciate where I spent that night on Friday 🌵
2
329
There may not be baseball on right now. But in the spirit of the season, I went by the locations today where the Spring Training arrival scenes in Major League were filmed. University of Arizona campus: Tucson, AZ.
The Major League, Bob Uecker call-back on this was soooooo good.
1
378
The Major League, Bob Uecker call-back on this was soooooo good.
“The Brewers win the Pennant! Oh my God the #Brewers win the pennant” What an incredible call by Jeff Levering on the radio
5
74
5
946
55,165
Walter Johnson Roger Clemens Gaylord Perry Curt Schilling Whitey Ford 524.7 total career WAR. I’ll buy lunch for anyone who can assemble a fivesome here with a higher number. Johnson is second all-time in WAR behind only Babe Ruth. Key is Clemens is third all-time in pitching WAR, above 4/5 $5 pitchers. Schilling is also far ahead of several pitchers valued higher.
Build a 4-man Starting rotation You have $15 to spend
1
224
Hornsby-Wagner-Boggs-Bagwell-Piazza. Total career WAR of 491.1. If anyone can find a combo with a higher combined WAR, I’ll send them lunch. Key is Wagner-Hornsby, who are 10th & 12th all-time, respectively.
Build an infield + Catcher You have $15 to spend
1
2
795
With the @MLB regular season now complete, it gave me an opportunity to do a deep-dive into which teams really stood out on @tiktok_us during the regular season. 𝐒𝐩𝐨𝐢𝐥𝐞𝐫 𝐀𝐥𝐞𝐫𝐭: The @Nationals, @Brewers and @Royals finished the season atop the podium. Shout-out to @nickcicero and @mondometrics, whose data was vital in assembling the below chart. 𝐗-𝐀𝐱𝐢𝐬/𝐇𝐨𝐫𝐢𝐳𝐨𝐧𝐭𝐚𝐥: Each team's number of wins this season 𝐘-𝐀𝐱𝐢𝐬/𝐕𝐞𝐫𝐭𝐢𝐜𝐚𝐥: Each team's median Exposure Rate for all of their TikToks this season Comparing pro sports teams on social is difficult, when teams in larger markets and teams with better on-fields records have tremendous advantages. So, rather than just providing another one of those after-season recaps that inevitably results with the @Dodgers and @Yankees on top, this chart provides context based on both of those factors that are beyond the control of the social teams. Similarly, by using Medians rather than averages, we're focusing on teams who performed consistently well, rather than having season totals inflated by a few viral posts. As much as possible, we're showing which social teams stood out, rather than compiling the teams with the best records and biggest markets that resulted in the largest grand totals. 𝐓𝐡𝐞 𝐟𝐚𝐫𝐭𝐡𝐞𝐫 𝐭𝐨 𝐭𝐡𝐞 𝐫𝐢𝐠𝐡𝐭 𝐭𝐡𝐞 𝐭𝐞𝐚𝐦 𝐢𝐬: The better their on-field performance; the higher up on the vertical side, the better their TikTok performance, per post. 𝐓𝐡𝐞 𝐦𝐨𝐫𝐞 𝐢𝐧 𝐭𝐡𝐞 𝐭𝐨𝐩-𝐥𝐞𝐟𝐭 𝐚 𝐭𝐞𝐚𝐦 𝐢𝐬: The more they punched above their weight. Some teams, in particular, deserve their flowers. 𝟏. 𝐖𝐚𝐬𝐡𝐢𝐧𝐠𝐭𝐨𝐧 𝐍𝐚𝐭𝐢𝐨𝐧𝐚𝐥𝐬: Despite finishing below .500 and having the fewest followers in MLB, the Nationals performed the best relative to their platform side of every team in baseball. 𝟐. 𝐌𝐢𝐥𝐰𝐚𝐮𝐤𝐞𝐞 𝐁𝐫𝐞𝐰𝐞𝐫𝐬: As much as they were supported by a 103-win team, the Brewers social squad -- like their baseball team -- vastly outperformed teams in larger markets. 𝟑. 𝐊𝐚𝐧𝐬𝐚𝐬 𝐂𝐢𝐭𝐲 𝐑𝐨𝐲𝐚𝐥𝐬: Finished last in the AL Central on the field and play in one of the league's smaller markets, yet had the best Median Exposure Rate in the American League.
2
2
581
I’ll add: Higuera’s career arc is comparable to Tim Lincecum in terms of career length buoyed by a few years of sheer dominance. Except Higuera’s three best years generated more WAR than Lincecum did in his entire career. The two couldn’t be more opposite stylistically. But in overall quality, very comparable pitchers. Yet Higuera’s mostly forgotten by general baseball fans.
Unrelated to CC being a legend (because he is), I’m always amazed at how underrated and forgotten Teddy Higuera has been as a @Brewers great. Had the highest WAR (9.4) in baseball in 1986. His career Brewers WAR is higher than CC’s with the Cleveland in fewer starts. His average WAR per season was better than Hall of Famers Nolan Ryan, Don Sutton, Whitey Ford & Catfish Hunter. Clearly best Brewers pitcher ever IMO.
346
Unrelated to CC being a legend (because he is), I’m always amazed at how underrated and forgotten Teddy Higuera has been as a @Brewers great. Had the highest WAR (9.4) in baseball in 1986. His career Brewers WAR is higher than CC’s with the Cleveland in fewer starts. His average WAR per season was better than Hall of Famers Nolan Ryan, Don Sutton, Whitey Ford & Catfish Hunter. Clearly best Brewers pitcher ever IMO.
Won a Cy Young with one franchise and is quite literally the best pitcher in franchise history for the other. This man absolutely would not have to choose.
1
1
690
This is a great get by @TheHockeyNews, and hopefully a sign of some exciting days ahead in the Texas hockey scene. Congratulations, @JennyStreeter3!
This quoted post is unavailable.
1
6
1,207
I had one old wooden stick left, but I’m afraid it’s bitten the dust. Crowdsourcing this. If anyone knows of any place that still makes wooden sticks, my DMs are open. The catch: I’m 6-foot-4, so they need to be at least 64 inches (measured from the heel).
3
2
5
1,128