

Elevate Your Dataviz Skills with techniques, freelance & career advice and live group-coaching with @AlliTorban, @duncangeere, @Data_Soul and @W_R_Chase
- Tweets94
- Following52
- Followers501
- Likes123



ALT White text on aqua background says How to data viz responsibly. On the right, the image of a vintage data visualization.


ALT First page of a data visualization story, entitled “Disability, a matter of age?”. Text: According to the World Health Organization, 16% of the global population has significant disability. This percentage substantially increases with age. Visualization number 1: Half doughnut charts describing the prevalence of disability by age group. Text: Is this escalation common across all causes of disability? Let’s focus on the three most common groups. Visualization number 2: Treemap describing the number of people with disability, ordered by cause groups. The three main groups are : Musculoskeletal disorders (378 millions), mental disorders (255 millions) and neurological disorders (193 millions).

ALT Second page of the data visualization story “Disability, a matter of age?”. Text: First, musculoskeletal disorders seem very age-related, appearing with adulthood, and amplifying with old age. Visualization number 3: Bar chart describing the percentage of people affected by musculoskeletal disorders, by age group.

ALT Third page of the data visualization story “Disability, a matter of age?”. Text: In contrast, all age groups are impacted by mental disorders, although the prevailing cause evolves from adult stage. Visualisation number 4: Bar chart describing the percentage of people affected by mental disorders, by age group. Text: Lastly, the trend differs again with neurological disorders, which gather a variety of disability causes, expanding at specific moments of people’s lives. Visualisation number 5: Lastly, the trend differs again with neurological disorders, which gather a variety of disability causes, expanding at specific moments of people’s lives.


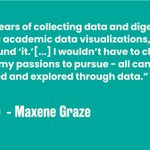
ALT Light text on green reads After years of collecting data and digesting cryptic academic data visualizations, I knew I had found ‘it.’ I wouldn’t have to choose one of my passions to pursue - all can be pursued and explored through data.” signed by Maxene Graze


