

Telling the stories of the companies that have shaped 30 years of ETF investing.
Learn More
Joined November 2026
- Tweets28
- Following10
- Followers317
- Likes8




Vanguard has just 2% of all 🇺🇸 ETFs
But its funds made 31% of all the money ETF investors made this past year
Vanguard vs all US 🇺🇸 ETFs over the past year:
- Share of ETFs that made money: 75% vs 72%
- Typical return: +10.1% vs +6.2%
- Fee per $100 invested: $0.04 vs $0.18
116 funds. ~$414B made for investors

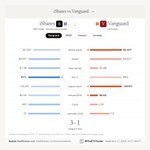
iShares just edged out Vanguard 👀
87% of iShares ETFs made money over the last 5 years
Vanguard: 86%
But Vanguard won almost everything else
iShares vs Vanguard, last 5 years:
- Typical return: +31.9% vs +34.8%
- Money made for investors: ~$1.20T vs ~$1.42T
- Fee per $100 invested: $0.16 vs $0.04
All 🇺🇸 ETFs: 80% made money, +32.7% typical return

3
112
Here are the ETF issuers that made the most money for investors over the past year:
🥇 Vanguard: ~$420B
🥈 iShares: ~$348B
🥉 State Street: ~$193B
4. Invesco: ~$98.0B
5. Schwab: ~$81.9B


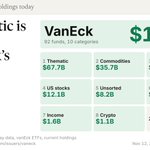
VanEck has 92 ETFs holding $156B.
Here's how much money they hold in each category:
🥇 Thematic: $67.7B (6 ETFs)
🥈 Commodities: $35.7B (6 ETFs)
🥉 Bonds and cash: $23.7B (20 ETFs)
4. US stocks: $12.1B (2 ETFs)
5. Other: $8.2B (22 ETFs)
6. Sectors: $4.7B (18 ETFs)
7. Income: $1.6B (3 ETFs)
8. Crypto: $1.1B (2 ETFs)
9. International: $857M (11 ETFs)
10. Buffered: $86.2M (2 ETFs)

STATE STREET VS ISHARES
Here's how the two ETF issuers compare over the past year:
- Money made for investors: ~$201B vs ~$369B
- Share of funds that made money: 78% vs 77%
- Typical fund return: +7.4% vs +8.4%
- Fee per $100 invested: $0.12 vs $0.16
- Money in their ETFs: $2.15T vs $4.64T
- Fees earned: $2.6B vs $7.5B
- Number of ETFs: 187 vs 482
- New ETFs launched in 2026: 16 vs 21
- Money made per fund: ~$1.1B vs ~$765M

96
76% of all 🇺🇸 ETFs made money over the past year
Here are the ETF issuers with the highest share of funds that made money:
🥇 AllianzIM: 49 of 49 (100%)
🥈 AAM: 9 of 9 (100%)
🥉 SEI: 8 of 8 (100%)
4. Nomura: 7 of 7 (100%)
5. Tema: 6 of 6 (100%)
6. VistaShares: 6 of 6 (100%)
7. Avantis: 29 of 30 (97%)
8. Harbor: 25 of 26 (96%)
9. Innovator: 149 of 156 (96%)
10. Dimensional: 39 of 41 (95%)
Source: theetftracker.com

98
163 new ETFs have launched in the 🇺🇸 over the last 90 days
Counting each launch once, 79 are down since they launched and 46 are up.
The best since launch:
🥇 $MNGB +66.9% 🟢
🥈 $PEPT +11.4% 🟢
🥉 $PBCS +10.9% 🟢
4. $POMG +9.6% 🟢
5. $OAKL +8.1% 🟢
The worst since launch:
🥇 $KATT -54.4% 🔴
🥈 $ASSX -49.3% 🔴
🥉 $CPU -36.5% 🔴
4. $OPTO -36.2% 🔴
5. $MNGZ -34.8% 🔴

115
Here are the ETF issuers with the lowest fees, per $100 invested each year (issuers with 10+ ETFs):
🥇 Vanguard: $0.04
🥈 Schwab: $0.07
🥉 State Street: $0.12
4. BondBloxx: $0.14
5. F/m Investments: $0.16
5. iShares: $0.16

2
108
188 of Invesco's 225 ETFs made money over the past year, 84% of them.
Here's how Invesco's 5 largest ETFs did:
- Invesco QQQ Trust $QQQ: +11.2% 🟢
- Invesco NASDAQ 100 ETF $QQQM: +11.2% 🟢
- Invesco S&P 500 Equal Weight ETF $RSP: +19.7% 🟢
- Invesco S&P 500 Momentum ETF $SPMO: +10.3% 🟢
- Invesco S&P 500 Quality ETF $SPHQ: +15.0% 🟢

Vanguard has launched 13 new ETFs so far in 2026, and 17 over the last 12 months.
Here are this year's launches:
Mar 24: 10 target maturity corporate bond ETFs
$VBCA $VBCB $VBCC $VBCD $VBCE $VBCF $VBCG $VBCH $VBCI $VBCJ
Apr 14: 2 developed markets ETFs
$VDG $VDV
Jun 2: Vanguard US High-Yield Corporate Bond ETF
$VCHY
@Vanguard_Group

1
115
Here are the ETF issuers that grew the most from new money over the last month:
🥇 Federated Hermes: +16.9% (+$511M), led by $FLCG +$171M 🟢
🥈 Direxion: +12.4% (+$8.4B), led by $SOXL +$7.1B 🟢
🥉 Neuberger Berman: +10.2% (+$401M), led by $NBSD +$339M 🟢
4. Eaton Vance: +9.8% (+$1.3B), led by $EVTR +$511M 🟢
5. NY Life Investments: +8.0% (+$643M), led by $HFXI +$218M 🟢
6. Alger: +8.0% (+$414M), led by $ALAI +$1.3B 🟢
7. PGIM: +7.6% (+$2.9B), led by $PAAA +$1.9B 🟢
8. NEOS: +5.7% (+$1.8B), led by $QQQI +$980M 🟢
9. VictoryShares: +5.6% (+$1.4B), led by $VFLO +$1.1B 🟢
10. SP Funds: +5.6% (+$249M), led by $SPUS +$177M 🟢

1
180
91% of Vanguard ETFs have made money over the last 5 years, vs 82% of all ETFs in the 🇺🇸.
Here's how Vanguard ETFs compare to all ETFs:
- Typical 5-year return: +40.5% vs +36.0%
- Fee per $100 invested: $0.04 vs $0.18
- Share of all 🇺🇸 ETFs: 116 of 5,824 (2.0%)
- Share of the money in 🇺🇸 ETFs: $4.59T of $16.18T (28.4%)
- Money made for investors over 5 years: ~$1.47T of ~$4.70T (31.3%)

1,138 new ETFs have launched in the 🇺🇸 so far in 2026.
Here are the issuers that launched the most:
🥇 Corgi: 207
🥈 Leverage Shares: 64
🥉 Tradr: 47
4. Defiance: 43
5. First Trust: 33
6. GraniteShares: 28
7. Direxion: 22
7. REX Shares: 22

Roundhill is the fastest-growing ETF issuer of 2026
Fastest-growing ETF issuers this year:
🥇 Roundhill: +176.0%
🥈 NEOS: +106.1%
🥉 iM Global Partner: +95.5%
4. PGIM: +86.1%
5. Bahl & Gaynor: +83.1%
6. Horizon Funds: +79.3%
7. John Hancock: +71.3%
8. Eaton Vance: +65.4%
9. Defiance: +64.5%
10. GMO: +64.1%
(Issuers with over $2B in ETF assets)

3
148
Vanguard's ETFs made an estimated $376 BILLION for investors this past year
Here are the ETF issuers that made investors the most money:
🥇 Vanguard: $376B
🥈 iShares: $327B
🥉 SPDR: $181B
4. Schwab: $77.0B
5. Invesco: $70.2B
6. Dimensional: $58.0B
7. First Trust: $25.8B
8. Avantis: $23.0B
9. VanEck: $21.8B
10. J.P. Morgan: $21.7B
11. Capital Group: $9.8B
12. WisdomTree: $9.7B

1
149
Here are the 10 largest Tradr ETFs and how much money they currently hold:
🥇 $SNXX Tradr 2X Long SNDK Daily ETF: $574M 🟢
🥈 $MQQQ Tradr 2X Long Innovation 100 Monthly ETF: $174M 🟢
🥉 $BEX Tradr 2X Long BE Daily ETF: $140M 🟢
4. $SNDQ Tradr 2X Short SNDK Daily ETF: $130M 🟢
5. $AAOX Tradr 2X Long AAOI Daily ETF: $115M 🟢
6. $TSLQ Tradr 2X Short TSLA Daily ETF: $108M 🟢
7. $LITX Tradr 2X Long LITE Daily ETF: $98.8M 🟢
8. $AXTX Tradr 2X Long AXTI Daily ETF: $92.6M 🟢
9. $NEBX Tradr 2X Long NBIS Daily ETF: $92.3M 🟢
10. $APPX Tradr 2X Long APP Daily ETF: $85.6M 🟢
@TradrETFs

Fidelity has 84 ETFs holding $188B
Here's how much money @Fidelity holds in each category:
🥇 US stocks: $47.0B
🥈 Sectors: $40.4B
🥉 Bonds and cash: $39.5B
4. Low-cost core: $17.8B
5. Crypto: $15.0B
6. International: $13.4B
7. Income: $12.0B
8. Buffered: $1.0B
9. Other: $1.0B
10. Thematic: $933M

1
115
