

EZPZ Trading is a gateway to innovative market research, analysis, and signals for options and equities tailored for retail traders. #EZPZ #EZPZTrading #ZPZcoin
Los Angeles, CA
Joined April 2023
- Tweets398
- Following6
- Followers1.7K
- Likes622




Pinned Tweet
🚨 WALL STREET JUST GOT ABSOLUTELY NUKED FROM ORBIT!!! 💥📈💥
EZPZ Trading just dropped the nuclear codes 🤯
the long-awaited Synthetic Float Ratio Leaderboard is now FULLY PUBLIC and it's exposing the mother of all structural imbalances in the market!
We're talking "synthetic shares" on steroids.
Real short interest? Cute.
Synthetic short exposure? Hell yah!
This is the hidden cancer that's been rotting the float from the inside out.
Full methodology + framework just published... a complete blueprint for detecting these equity market time BOMBS:
Go see the damage here: 🔥
Leaderboard (Synthetic Float Ratio): ezpztrading.com/market-data/…
The full study / article (this is the red pill): ezpztrading.com/blog/estimat…
This isn't just data.
This is the map Wall Street NEVER wanted retail to have.
Buckle the fuck up.
The squeeze isn't coming...
It's already loaded. 🔥

See dealer hedging pressure as it happens with EZPZ HIFRO. 📊
Our HIFRO dashboard brings real-time options hedging activity into focus.
Track cumulative options flow, buying and selling pressure, key gamma levels, Call & Put Walls, and potential shifts in dealer hedging activity.
Get deeper insight into how options flow may influence market direction throughout the trading session.
Explore HIFRO and make more informed trading decisions. 🎯
ezpztrading.com/s/97bc9b2e-7…

See the full market picture with EZPZ VolMap Pro. 📊
Track volume density, liquidity zones, POC, VAH/VAL, VWAP, Gamma Flip, and Call & Put Walls — all in one interactive view.
Identify key price levels, monitor buying and selling pressure, and understand where liquidity is concentrated.
Trade with better market context. 🎯
Explore EZPZ Trading: ezpztrading.com/s/7c42c472-6…

This is EZPZ Trifecta and it changes how you read $SPY
SPX, SPY and QQQ gamma on one screen: Gravity, Call & Put Walls, Gamma Flip, Net GEX, a strike heatmap and WhaleTrace for the big prints. And you can replay any session bar by bar
Yesterday SPY opened right on Gravity 738 and under the 740 Gamma Flip. It never got back above 740, so it stayed in Negative Gamma all day. As it sold off, Gravity stepped down 738 → 735 → 730. SPY tagged 730 (Gravity + Put Wall), bottomed at 728.93 and bounced +$3.47 into the close
Take a look 👇
ezpztrading.com/s/0783fba8-5…
EZPZ Trading retweeted

Due to popular demand. All now on one page.
Meet the Trifecta:
ezpztrading.com/s/ce3eb15e-7…

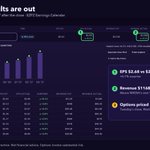
$NVDA results are out.
EPS: $2.68 vs $2.52 est (+6.1%)
Revenue: $116B vs $111B est (+4.1%)
Revenue came in above the top of NVIDIA's own $108B ±2% guide.
Options priced ±8.2% into the print (Tuesday's close, Wed expiry).
After hours: up about 4%, near $161.6 (7:25 PM ET). Inside the priced range so far.
NFA. Options involve substantial risk.


$NVDA reports tonight, its first report since Jensen Huang resigned.
Options are pricing a ±8.4% move. Here's what the market looked like at Monday's close:
• Range through Wed: $143.09 to $169.19
• Wednesday's options: ~141% implied volatility, for one day
• Monday's big money: only ~12% went to this week's expiries
• Last 4 reports: beat EPS every time. The stock still fell after 3 of them.
That's the size of the move, not the direction.
Save this for 4:20 PM ET.
NFA. Options involve substantial risk.
Every earnings report this week, with the implied move, EPS and revenue vs estimates, and the beat/miss result. Free:
ezpztrading.com/news/earning…

$NVDA in 60 seconds, before tonight's report.
±8.4% priced, either way. ~141% IV in Wednesday's options. And the big money mostly looked past this week.
NFA. Options involve substantial risk.
Are SPX, SPY, and QQQ telling the same story? Or is the options positioning diverging? 🎯
Introducing EZPZ Trifecta — compare three major index markets side by side, all in one view.
Track what matters:
🔹 Gravity Levels – Identify key price attraction zones.
🔹 Call & Put Walls – Monitor important options positioning levels.
🔹 Gamma Flip – Understand where gamma exposure changes.
🔹 Net GEX & VEX – Compare options exposure across markets.
🔹 Options Heatmap & Ladder – Explore strike-level positioning.
🔹 Live & Replay Modes – Analyze market activity and revisit previous sessions.
One screen. Three markets. A clearer picture of options positioning.
Stop switching between charts. See the bigger picture with EZPZ Trifecta. 🚀
Explore here:
ezpztrading.com/option-chart…

$NVDA reports tonight, its first report since Jensen Huang resigned.
Options are pricing a ±8.4% move. Here's what the market looked like at Monday's close:
• Range through Wed: $143.09 to $169.19
• Wednesday's options: ~141% implied volatility, for one day
• Monday's big money: only ~12% went to this week's expiries
• Last 4 reports: beat EPS every time. The stock still fell after 3 of them.
That's the size of the move, not the direction.
Save this for 4:20 PM ET.
NFA. Options involve substantial risk.
Last 4 $NVDA reports, next-day move:
+8.7%
−1.8%
−5.5%
−3.1%
EPS beat estimates every time. The stock still fell after three of them. Average size: 4.8%, against ±8.4% priced now.
Past moves, not a forecast. NFA.
4
87
Monday's unusual $NVDA flow, $897.7M in all:
Tagged bullish: $193.7M
Tagged bearish: $225.5M
Near the middle: $478.5M
Only ~12% went to this week's expiries. The biggest print was 12,250 Mar 2027 $145 puts, long-dated.
Nov 20 gamma map (EZPZ estimate):
Flip near $161.25 · Put wall $150 · Call wall $170
One session of context, not a signal. NFA.
3
57
Where the earnings premium sits.
At-the-money IV at Monday's close:
Wed Nov 18: ~141%
Nov 30: ~78%
One report, packed into one day of options. Most of that extra premium usually comes out once the report is out, whichever way the stock goes.
NFA. Options involve substantial risk.
3
44
Full breakdown: the price ladder, the IV curve by expiry, Monday's biggest prints and the gamma map.
ezpztrading.com/blog/nvda-ea…

$NVDA options are pricing a ±8.4% move into tonight's report. The last 4 reports moved 4.8% on average.
Bigger or smaller this time?
Full breakdown at 8:30 AM ET, Follow so you catch.
NFA. Options involve substantial risk.
52%Bigger than ±8.4%
48%Smaller than ±8.4%
23 votes • Final results📊 Is SPY options flow turning bullish or bearish?
Don't just look at today's options activity. Understand the bigger picture.
Our Money Sentiment analytics break down:
🔹 Bought Ratio
🔹 Net Call & Put Sentiment
🔹 Overall Net Sentiment
🔹 30-Day Average Sentiment
🔹 Options Premium Flow
Compare short-term positioning with the broader sentiment to see what the options market is showing.
Follow the money. Understand the sentiment.
👉 Read the full breakdown:
ezpztrading.com/blog/money-s…

🚨 SPX and SPY are flashing BULLISH. QQQ and NDXP are flashing BEARISH.
And SPX traders bought more puts than calls anyway: a 1.16 put/call ratio against a 0.91 30-day average.
📊 What each of the 8 premium traffic lights means
🧭 How to read every column of the index options table
🛠️ A 3-minute routine to check index direction before you trade
Read the full guide 👇
ezpztrading.com/blog/index-t…

$SPX open, in 18 minutes:
Estimated dealer hedging flow across SPX, SPY and XSP options fell below -$400M twice as price slid toward 7580. By 9:48 AM ET it was back to +$45M.
SPX is still under its Gamma Flip (7607), where hedging tends to add to moves.
NFA.

Where is volume building? Where are buyers and sellers active? And where is gamma exposure concentrated? 📊
Introducing EZPZ VolMap Pro — a powerful market visualization tool, now available on EZPZ Trading.
See the bigger picture with:
🔹 Volume Density Heatmap – Visualize areas of concentrated trading activity.
🔹 POC, VAH & VAL – Identify key market-profile levels and value areas.
🔹 Gamma Exposure (GEX) – Track positive and negative gamma concentrations.
🔹 Call & Put Walls – Monitor important options positioning levels.
🔹 Large Trade Bubbles – Spot significant trading activity directly on price candles.
🔹 VWAP & Buy/Sell Pressure – Add more context to intraday price action.
Price action, volume and gamma exposure — all in one chart.
Explore VolMap Pro. 🚀
ezpztrading.com/trading-view…

EZPZ Trading retweeted

24 hours.
this time tomorrow, the ZPZ presale opens on zpzcoin.io.
wallet ready? reply with a ✅ if you're set.
zpzcoin.io/pre-sale?utm_sour…
Crypto is highly speculative and volatile. You could lose the entire amount you contribute. Nothing here is investment advice.
What happens behind the scenes when options flow moves the market? 📊
Introducing HIFRO (Hedging Impact Flow of Real-Time Options) — now live for members on EZPZ Trading.
HIFRO models estimated dealer hedging pressure to help you understand how options activity may influence price action.
Here's what you can track:
🔹 Cumulative & Windowed Flow – Understand how estimated hedging pressure builds over time.
🔹 Dynamic Call & Put Walls – Identify important options positioning levels.
🔹 Key Gamma & Gamma Flip – Track critical gamma levels that can influence market behavior.
🔹 Flow Bursts & Wall Breach Alerts – Monitor significant changes in options flow and key levels.
🔹 Live Options Flow Data – Dive into individual contracts, premiums, strikes and trade activity.
Understand the pressure behind price movement. Make more informed trading decisions.
Explore HIFRO on EZPZ Trading. 🚀
ezpztrading.com/option-chart…
