

Climate scientist, NCAS/University of Reading | IPCC AR6 Lead Author | MBE | Warming Stripes: https://teapawt.net/t.co/RHRXsr7zE5 | Views own
Reading, England
Joined September 2009
- Tweets12.4K
- Following1.3K
- Followers94.4K
- Likes11K




Pinned Tweet
The summer of 1976: putting a very hot & dry summer into context
50 years on, the summer of 1976 is often misused by those wanting to downplay the risks from climate change as it still holds a small, but reducing, number of temperature records.
climatelabbook.substack.com/…


Ed Hawkins retweeted

Think you know what it takes to stop global warming? When Prof @ed_hawkins told me this 👇 a little while ago, it changed my understanding completely.
I mention it in this month's Spencer Kelly on the Edge, which, I promise, gets less bleak towards the end...
Ed Hawkins retweeted

Our impact on 🌍’s climate is undeniable. In this simple but powerful data visualization, Prof @ed_hawkins illustrates annual avg global temperature since 1850. On climate change, our task is large, the window of opportunity is short and the risks are existential. @COP26

The 13 biggest myths about heatwaves – and how to bust them
theguardian.com/environment/…

Framing the causes of hotter heatwaves
The recent reductions in aerosol emissions have acted to unmask the warming that was already caused by past greenhouse gas emissions
climatelabbook.substack.com/…
Ed Hawkins retweeted

For our friend’s in #Europe I put together a “map of record” for the June 2026 #Heatwave - the most severe in Europe’s history - with the help of @extremetemps Thank U!
All-Time National Heat Records:
Germany — 41.8°C (107.2°F)
Czechia — 41.9°C (107.4°F)
Denmark — 37.0°C (98.6°F)
Poland — 40.5°C (104.9°F)
Belarus — 40.4°C (104.7°F)
Slovakia — 41.3°C (106.3°F)
Hungary — 42.0°C (107.6°F)
Luxembourg — 40.9°C (105.6°F)
Jersey — 39.3°C (102.7°F)
Guernsey — 36.4°C (97.5°F)
June National Heat Records:
Austria — 40.1°C (104.2°F)
Croatia — 41.0°C (105.8°F)
Slovenia — 38.7°C (101.7°F)
Montenegro — 41.7°C (107.1°F)
Lithuania — 36.3°C (97.3°F)
UK — 37.7°C (99.9°F)
Switzerland — 39.0°C (102.2°F)
Isle of Man — 27.6°C (81.7°F)
Belgium — 39.9°C (103.8°F)
Netherlands — 39.4°C (102.9°F)
@DaveThroup @ed_hawkins @or_bit_eye @DavidUllrich202 @dwallacewells @PGDynes

How much warmer than normal was the UK over the last two days?
If you're wondering whether we need a new colour scale... you're not wrong.
Maps show anomalies of daily maximum temperatures, relative to 1991-2020.
Based on HadUK-Grid dataset and produced by the @metoffice NCIC


Ed Hawkins retweeted

“The 15 consecutive days over 32°C in 1976 would become 15 consecutive days over 35°C (three degrees hotter) in today’s climate.”


We recreated the legendary heatwave summer of 1976 in today’s climate – here’s what we found
theconversation.com/we-recre…

We recreated the legendary heatwave summer of 1976 in today’s climate – here’s what we found
theconversation.com/we-recre…

Ed Hawkins retweeted

The irony of the climate conference i attended yesterday is actually quite scary.
The gathering of Climate scientists, public sector emergency services, health and food production experts in central London was to give us a glimpse of the future should we continue to burn fossil fuels for heating and propulsion.
Planned to coincide of the 50th Anniversary of the start of the summer of 76 heatwave, where temperatures of 35⁰ were felt.
Today, many parts of the will reach 35⁰ and more. By Thursday we're looking at 39⁰ possibly 40⁰
Is 45⁰ degree just around the corner?
Let's keep burning fossils and find out.
Happy anniversary sun lovers
@Lauratobin1 @ed_hawkins
@adamvaughan_uk
@EnergyUKcomms
@parents4futureG

Ed Hawkins retweeted

🟦🟥 Danas je #ShowYourStripesDay!
Klimatske pruge, koje je osmislio klimatolog @ed_hawkins, jednostavna su i snažna vizualizacija promjene temperature zraka kroz vrijeme.
Svaka pruga predstavlja jednu godinu i pokazuje je li godišnja srednja temperatura zraka za određeno područje bila niža ili viša od višegodišnjeg prosjeka.
Plave pruge označavaju hladnije, a crvene toplije godine.
Porast temperature zraka jedan je od najjasnijih pokazatelja klimatskih promjena, koje donose i sve veće rizike: češće toplinske valove, ekstremne oborine te dugotrajnije i izraženije suše.
Zato je uloga nacionalnih hidrometeoroloških službi sve važnija.
Pouzdana motrenja, prognoze i upozorenja pomažu društvu da se prilagodi tim promjenama, zaštiti ljude i imovinu te planira sigurniji i otporniji prostor.
Nacionalne hidrometeorološke službe pridonose i ublažavanju klimatskih promjena.
Meteorološke prognoze i klimatski podaci ključna su podloga za planiranje proizvodnje energije iz obnovljivih izvora.
Vizual je izrađen pomoću @CopernicusECMWF ERA Explorera.
I vi možete izraditi klimatske pruge za svoj grad ovdje: 👇
era-explorer.climate.coperni…
#ShowYourStripes #DHMZ
Ed Hawkins retweeted

It’s #showyourstripes day!
The climate stripes are a data visualization to portray long-term temperature trends in different locations around the world, developed by scientist @ed_hawkins
Show your stripes to start a conversation in your community 👉 showyourstripes.info/

Ed Hawkins retweeted
Today is #ShowYourStripes day. A day when those concerned about the climate challenge raise awareness. I helped start the day in 2018 with the genius creator of the Warming Stripes Prof @ed_hawkins and the incredible @BernadetteWoods
It’s grown by leaps and bounds globally since.
These stripes represent the last 2000 years of temperatures. Blue = below normal. Red = above normal. This graph tells a simple tale of runaway warming over the last 100 years due to carbon pollution. Its unsustainable and it shows humans have become the fundamental force of nature. We must get a hold on it soon.
You can participate by showing your local stripes by downloading here: showyourstripes.info or here: climatecentral.org/climate-m… #climatechange

Today is #ShowYourStripes day!
This year, St Michael's Tower atop Glastonbury Tor is encouraging everyone to use the Climate Stripes to start a conversation about climate change and the actions they are taking.
Thank you @nationaltrust!
Graphics: ShowYourStripes.info
Ed Hawkins retweeted
It’s that time again: Tomorrow/ Saturday/Summer Solstice is #ShowYourStripes day! It’s your chance to show off your city’s stripes and communicate the climate challenge!
So download either here: showyourstripes.info/ or here: climatecentral.org/climate-m…

34.8°C in the UK.
In May.
Warmest spring day ever.
Beating the previous record by 2°C.
Burning fossil fuels has made this heatwave hotter.
True for the UK today, and everywhere else, all of the time.
Spiralling global temperatures (1850-2026)
It is exactly 10 years since I first put this animated graphic of changes in global temperature online. #ClimateSpiral
It instantly went viral.
People watched it over and over again.
It still offers the power to shock a decade on.
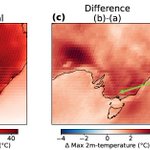
How would observed extreme events differ in warmer or cooler climates?
First results from the ReBASE (Reanalysis-Based Attribution and Storylines of Extremes) project are now available, with analysis by Rhidian Thomas & Vikki Thompson.
#EGU26 Poster: ed-hawkins.github.io/ReBASE/…

Example 3: wet month in the UK
January 2014 was extremely wet for SE England, but had the same weather patterns happened in a cooler 1950s climate it would have been 10-20% less wet, with reduced impacts.

These examples highlight that the ReBASE approach is flexible to explore a wide range of extreme event types, all over the world.
Get in touch if you have specific events you want to look at, especially in 1909-1911, 1975-1976 & 2014-2025.
Project: ed-hawkins.github.io/ReBASE/