

Founder of Millennial Media Group • Investor • Sharing insights on crypto, markets & macro
Panama
Joined May 2025
- Tweets664
- Following158
- Followers141
- Likes208



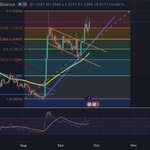


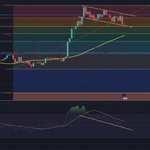


ripple:native is testing a key level right now!👀
Price is attempting to hold above the 0.236 Fib level.
If it succeeds, we could see another attempt to break above the recent high.
If it fails, there’s strong support around the 0.382 Fib, the area between $1.43 - $1.37 where we also have confluence with:
→ The ascending diagonal support
→ The upper boundary of the previous downtrend channel, which has now flipped from resistance into support
A key area to watch for XRP.

1
1
67
solana:So11111111111111111111111111111111111111112 at a MAJOR decision point today! 🚨
Solana is still trading inside a descending channel, but price is currently holding a strong support confluence - the lower boundary of the channel + the 0.382 Fib level around $95.
The latest pullback came as the CLARITY Act failed to advance in the Senate, triggering a broader sell-off across crypto.
Today all eyes are on the Fed. 👀
A rate hike is heavily expected but its likely already priced in, so if they hike rates I think that the market will bounce back.
If this support continues to hold, I’m watching for a potential #Solana bounce back toward the upper boundary of the channel (around the 0.2 fib level).

#Bitcoin Weekly Update: More Downside Ahead?🚨
Bitcoin is holding the 0.2 Fibonacci level as support, but price is still struggling to break above the 50 SMA and the horizontal resistance.
RSI is also showing a hidden bearish divergence, which could favor a continuation of the current downtrend.
If BTC gets rejected from this area, I’m watching the 0.2 Fib level again for support.
If price manages to break above the 50 SMA and horizontal resistance, that would be the first strong sign of bullish continuation.

2
70
hyperliquid:native Price is jumping, but watch out for a possible pullback! 🚨
Price is still trading inside a descending channel and is currently sitting at the channel resistance.
It recently bounced from a strong support confluence - horizontal support, the lower boundary of the channel, and the 200 SMA.
RSI is also showing a hidden bearish divergence, which could favor trend continuation.
If price manages to break out of the channel, the next key area is the horizontal resistance above, where the major SMAs are also clustered.
If a pullback occurs, I'm watching the lower boundary of the descending channel, where it aligns with horizontal support and the 200 SMA.

1
59
solana:So11111111111111111111111111111111111111112 Classic Bull Flag Forming!🚨
After the sharp move higher, #Solana is consolidating beneath resistance while holding the breakout area.
The structure is starting to resemble a bull flag:
Strong impulse → tight consolidation → lower highs → support holding.
A clean break above the descending trendline would confirm the pattern and potentially open the door for another leg higher.
Confirmation is still needed.

40
hyperliquid:native : The Setup Is Bullish - CPI Is the Catalyst!
Price is pressing against the upper boundary of the ascending channel, with a potential breakout in play.
More importantly, price is now sitting on support at the previous double top resistance - a key level to hold if the bullish structure is going to continue.
The momentum setup is also constructive: price has printed higher lows while RSI has printed lower lows, creating hidden bullish divergence.
That gives the setup a favorable asymmetry into a potential channel breakout.
But today’s CPI is the catalyst. The reaction to the print will likely determine whether this support holds and price makes a sustained attempt through channel resistance.
Above channel resistance: continuation.
Below support: thesis weakens materially.

47
Filip Vantchev retweeted

LINK just printed a possible double top - and it's resting on the exact level that confirms or kills it.
-Two failed pushes near $13.5 left a possible double top
-The whole thing now rests on ~$11.7 - hold it and the uptrend lives, close below and $10 is in play
-Momentum is cooling: RSI rolled over from the low 70s
But the bigger trend is still up, price well above every major average 📈
So: short-term exhaustion inside a strong uptrend. $11.7 is the level to watch.

bitcoin:native BULLISH MOMENTUM IS BUILDING!
Price is testing the same major resistance it faced in May, but RSI is now printing a significantly higher high. 📈
Same price. Much stronger momentum.
However, price remains below the 50 SMA, which is acting as key resistance.
A clean break above the 50 SMA could open the door for the next leg higher.
#Bitcoin

39
hyperliquid:native BEARISH DIVERGENCE FLASHING!🚨
Price remains firmly inside its ascending channel, continuing to print higher highs. 📈
But RSI is telling a different story - lower highs as price pushes higher. 📉
That’s a classic bearish RSI divergence, signaling that bullish momentum may be weakening.
The uptrend remains intact for now, but this is one signal worth watching closely.

DELL IS FLASHING A MAJOR WARNING SIGNAL!🚨
Price keeps making HIGHER HIGHS 📈
RSI keeps making LOWER HIGHS 📉
A textbook bearish divergence is forming on weekly chart as $DELL pushes toward resistance.
Momentum is fading while price keeps climbing.

1
2
122
ripple:native BREAKING OUT OF A BULL FLAG! 🚀
After a strong rally, XRP formed a bull flag and found support exactly at the 0.5 Fibonacci level near $1.34.
Price is now attempting to break out while the RSI turns higher.
A daily close above the 0.382 Fib at $1.43 could open the way toward $1.53, where the 0.236 Fib resistance sits.
Confirmation is key: if XRP retests the upper boundary of the flag and successfully defends it as support, the uptrend is likely to continue.

Bullish setup taking shape for hyperliquid:native!🚀
After the strong move up, price is consolidating into an ascending triangle.
RSI has also cooled off while price holds near the highs.
A clean breakout above resistance with retest confirmation could signal continuation of the uptrend.

#SILVER IS SHOWING SOME WEAKNESS!🚨
Price has broken below the uptrend channel and is now testing the 0.382 Fib around $64.9.
If this level fails to hold, I’m looking at around $63 as the next key support where the 0.5 Fib aligns with another strong horizontal support zone.

1
87
HYPE PULLS BACK AS RATE HIKE BETS SURGE!🩸
hyperliquid:native is cooling off after its recent run to new highs as markets digest rising expectations for another Fed rate hike.
Technically, the structure is still bullish.
Price remains inside the ascending channel and is now testing its lower trendline support.
If this level fails, the first major area I’m watching is the 0.236 Fib around $78.4.
There’s another warning sign:
Price → Higher Highs 📈
RSI → Lower Highs 📉
That’s a bearish RSI divergence, suggesting momentum has been weakening despite price pushing higher.

68
ripple:native IS RUNNING OUT OF ROOM!🚀
After a massive impulse higher, price has been consolidating inside a bull flag.
Now, price is pushing toward the upper trendline again.
A confirmed breakout + successful retest could open the door for the next leg higher.

41
#Ethereum is getting ready for its next BIG move!💥
ethereum:native is forming a bullish pennant on the 4H chart.
What makes this setup even more interesting is the RSI:
Price is making higher lows, while RSI is making lower lows - a hidden bullish divergence, which can signal trend continuation.
Now it’s all about confirmation.
A breakout above the pennant followed by a successful retest could open the door for another move higher.
If ETH breaks below the lower trendline and confirms it as resistance instead, the bullish setup weakens and a deeper pullback becomes more likely.
Both scenarios are clear. Now we wait for the market to choose.

hyperliquid:native is sitting in an interesting spot around $80.
The liquidation map is showing a clear asymmetry:
Short liquidations are stacked aggressively just above current price, with the first major pocket starting around $84–85.
If buyers push HYPE into that zone, liquidations could become forced buys, pushing price higher and triggering the next cluster.
That’s how a short squeeze starts feeding itself.
The interesting part?
There’s nearly $600M in cumulative short liquidations by ~$105, while the largest long liquidation clusters require a much deeper move lower.
So the setup isn’t simply “bullish.”
It’s asymmetric.
Above $84–85, shorts could become fuel.
Below $75, the picture changes completely and the long liquidation cascade becomes the risk.
Right now, the closest pool of leverage looks to be above price.

55
#HYPE WEEKLY CHART IS FLASHING A WARNING!🚨
Hyperliquid showing a bearish divergence on the weekly RSI as price pushes into a new ATH.
Price is now retesting the breakout around $77 — the previous ATH.
If bulls can hold this level, the breakout structure remains intact.
If $77 fails, ~$72 is the next key support zone I'd be watching.
New ATH in price + lower high on RSI = something to keep an eye on!
hyperliquid:native

98