

In crypto since 2019 | Alpha Research | I print while they cope.
Join my TG →
Joined November 2024
- Tweets6.1K
- Following136
- Followers4.9K
- Likes14.3K

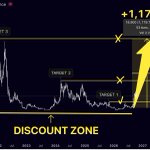


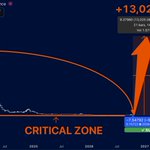


$IDOL is starting to look interesting again.
After months of bleeding, buyers are finally showing up.
$0.027 is my first target.
$0.033 comes next.
$0.042 if momentum really kicks in.
That's a potential 5x from the recent lows.
Most people won't even notice until the first big green candle.

$NEAR is looking dangerously bullish.
Everyone sees $4.70.
I'm looking at $20.
Years of accumulation near the bottom
and now the weekly chart is finally showing signs of life.
My targets:
$9.06 → $20.50
That's a potential +1,179% move in the bullish scenario.
Call me crazy, but I think the real $NEAR rally hasn't even started yet.

$BLESS is one of those charts people will ignore until it's too late.
Trading around $0.01.
Support keeps holding, and the price is slowly building a base.
My targets:
$0.0129
$0.0301
$0.0373
That final target represents a potential +387% move from the setup shown.
The funny part?
People will probably start getting excited at $0.03.
I'm much more interested in watching it here.
$BLESS looks worth keeping on the radar.


$STRK IS DOWN 98%.
From $7.70 to just $0.046.
Almost everyone has abandoned this alt.
And that's exactly why I'm watching it.
The weekly chart is sitting in a critical zone after nearly 3 years of bleeding.
My wild target? $9+.
That's over 13,000% upside.
Sounds completely insane, I know.
But if $STRK ever makes a serious comeback
this chart could look very different.
The risk is massive. So is the potential.

$PYTH AT $0.073.
My targets:
$0.24 → +229%
$0.54 → +641%
$1.15 → +1,475%
Look at the weekly chart.
Years of selling. Almost everyone has given up on it.
And now $PYTH is sitting near its historical lows.
This is exactly where I start paying attention.
If a real reversal begins, I think the upside could be massive.
$1+ sounds crazy today.
But so did plenty of moves before they happened.
I'm watching this one closely.

I've been looking at $MORPHO on the daily chart
and one pattern keeps repeating.
Accumulation. Breakout. Higher prices. Repeat.
First around $1.10, then $1.50, then $1.60.
Now we're seeing another potential accumulation zone around $2.10.
And every time buyers have defended these areas
the next move has been higher.
My targets:
🎯 $3.00
🎯 $3.50
🎯 $5.00
The $2.10 support is the key level I'm watching.
Lose that, and the bullish setup starts looking much weaker.
But if this pattern continues
I think $MORPHO could surprise a lot of people.
Sometimes the best charts aren't the ones making the most noise.
They're the ones quietly building higher floors.

Remember when everyone was calling AI the future and buying $FET above $2?
Now it's down over 90%, and the same people won't touch it.
I find that fascinating.
The weekly chart is sitting in a massive historical discount zone.
If buyers finally step in, the recovery could be explosive.
My targets:
🎯 $0.99
🎯 $2.21
🎯 $3.46
That's a potential 20x from here.
Of course, a cheap chart can always get cheaper.
But I think the risk/reward is worth watching.
The market has a funny habit of making people hate an asset right before they wish they'd bought it.

$TIA TO $30. YES, I'M SERIOUS.
Down 97% from its all-time high.
Everyone who bought the hype is either underwater or already gone.
And that's exactly why I'm paying attention.
Look at the weekly chart.
$TIA is sitting in a massive discount zone after nearly three years of bleeding.
My target? $30.
That's a potential 50x from the marked entry zone.
Sounds insane?
So did most crypto rallies before they happened.
I think the next major move could catch a lot of people completely off guard.
The market has a funny way of rewarding those who show up when nobody else wants to.

$XLM is setting up for something massive.
And I think most people are completely sleeping on it.
Look at the monthly chart.
The first accumulation phase lasted years before $XLM exploded.
Now we're seeing another accumulation structure forming at higher levels.
Coincidence? Maybe. But I'm not ignoring it.
My targets:
$0.517 → $0.643 → $0.80
That's a potential +556% from the chart's measured starting point.
The crazy part? $0.80 isn't even some ridiculous fantasy level.
It's a test of the previous major highs.
I'm watching this closely.
Because the biggest moves usually start when nobody gives a damn anymore

$NEAR is setting up for something BIG.
Look at the weekly chart.
We've spent years watching lower highs, endless selling
and traders completely giving up on this alt.
But now $NEAR is testing a major descending trendline while holding above its long-term accumulation zone.
If this breakout confirms
I see a potential path toward $25–$30.
That's over +2,120% upside from the chart's projected starting point.
Sounds crazy? So did $NEAR at $20 before it happened.
I'm watching this one very closely.

$QNT is doing something I haven't seen in a long time.
After years of sideways movement
it finally exploded above $170.
And now that same level could become major support.
That's the part I'm watching.
If buyers defend this zone, I see a possible path toward $400, then $700.
A potential 300%+ move from the breakout area.
The funny thing is, most people will probably notice $QNT only after another massive rally.
I'm watching the retest.
Are you?

$WLD is down almost 96% from its peak.
Most traders see a dead coin.
I see a chart that could get very interesting.
After nearly three years of bleeding
$WLD is sitting near its historical lows around $0.45.
My long-term target? $12–15.
That's a potential 4,000%+ move.
Crazy? Sure. But we've seen what happens when liquidity returns to forgotten altcoins.
The real question is whether $WLD can finally break out of this endless downtrend.
I'm keeping a close eye on it.

Now $TAO is trying to break away from that entire structure.
If this breakout holds, I see $800 as the first major upside area, followed by $1,300+.
That's roughly 472% potential upside.
And considering how quickly $TAO has moved in the past
I wouldn't underestimate what a real trend reversal could look like.
The key now is holding above the old resistance area.
I think the next major $TAO move could surprise a lot of people.

$PYTH is down so badly that almost nobody even talks about it anymore.
From $1.15 to $0.07. That's a brutal collapse.
But look at what's happening on the daily chart.
Price has been sitting near the same bottom for months.
Selling pressure appears to be fading
and even a small recovery could trigger a serious move.
My upside targets:
$0.24013
$0.54027
$1.15960
The full bullish scenario points to a potential +6,205% move.
Crazy numbers, I know.
And there's no guarantee the bottom is in.
But I find it interesting how everyone wants to buy altcoins after a 500% rally
while completely ignoring them near historical lows.
$PYTH doesn't need everyone to believe in it.
It needs buyers to come back.
Are we looking at accumulation or just another dead altcoin?

Everyone wants to buy $XLM after a 300% pump.
But at $0.16? Suddenly nobody cares.
Funny how that works.
Look at the weekly chart.
Years of accumulation near the bottom, multiple explosive rallies
and price keeps returning to the same demand area.
Now imagine a breakout toward $2.45.
That's roughly 3,290% upside from the marked base.
Sounds ridiculous?
So did most crypto rallies before they happened.
I'm not saying $XLM is guaranteed to reach that level.
But this is exactly the kind of long-term setup I refuse to ignore.
The biggest opportunities rarely look exciting at the beginning.

Something is happening with $NEAR
and I don't think enough people are paying attention.
For almost 5 years, every major rally has ended at a lower high.
Now price is pushing back toward that same descending trendline around $4.50.
This is where things get interesting.
A clean weekly breakout could open the door to $8
then $17, and potentially $25–$29 in a much bigger bullish cycle.
That's over 2,100% upside in my most aggressive scenario.
But here's the catch: until that trendline breaks
we're still looking at resistance.
I'm watching this one closely.
A breakout here could completely change the long-term picture for $NEAR.
Are we finally seeing the beginning of a new cycle?

Most traders OBSESS over finding the next 10x
Meanwhile, they're quietly LOSING money on trading fees every single day.
That's why I've partnered with @KCEX_Official
Here's what caught my attention:
→ 0% Spot trading fees
→ 0% Futures Maker fees
→ Just 0.01% Futures Taker fees
→ 0% withdrawal fees
→ Up to 5% APY on Flexible Savings
And there's an exclusive campaign for my community with trading rewards of up to **$120**, depending on your volume.
If you're actively trading $BTC, $ETH, $SOL or altcoins, those fees add up faster than you think.
Less money spent on fees. More capital stays in your account.
Join here: kcex.com/ru-RU/auth/signup?i…
Campaign ends October 25. New users only, KYC and eligibility requirements apply.
🤝 Paid partnership


Everyone loved $PEPE when it was pumping.
Now it's down massively from its highs
and most people have already moved on to the next shiny memecoin.
But I'm looking at the weekly chart, and something caught my attention.
Price is holding near a long-term liquidity zone.
If buyers regain control, the upside could be insane.
My targets:
$0.00000706
$0.00001620
$0.00002839
And my most aggressive scenario?
A potential 19x move toward $0.0000435.
Of course, none of this happens without serious momentum returning to memecoins.
But I've seen how quickly sentiment can flip in this market.
Would you buy $PEPE when everyone is bored of it?
