

Remote Sensing | Water Engineering | Precision Ag | AI Enthusiast | Retweets do not imply endorsement. Opinions shared on this account are personal.
USA
Joined October 2022
- Tweets166
- Following349
- Followers31
- Likes320
Wub Y retweeted

The 2026 #CSUTAPS Field Day & TAPS Tech & Partner Showcase brought competitors, partners, & ag community to the competition field. They explored ag tech behind TAPS, got competition updates, and lunch for a celebration of #farmerfocused #precisionag @TAPS_Network @CSUAgSci
Wub Y retweeted

When estimating causal effects, a fundamental question is: Which treatment effect are you actually interested in?
Two of the most common estimands are:
🔹 Average Treatment Effect (ATE): The average effect of the treatment across the entire population.
🔹 Average Treatment Effect on the Treated (ATT): The average effect among individuals who actually received the treatment.
The choice between ATE and ATT depends on the research question. If you want to estimate the average effect for everyone, ATE is typically the appropriate estimand. If you are interested in the effect among those who actually received the treatment, ATT is often the better choice.
This distinction is also important in Propensity Score Matching (PSM), where the target estimand should be aligned with the objective of the analysis.
The image below summarizes the definitions of ATE and ATT using the potential outcomes framework.
I have just released a new module in the Statistics Globe Hub in which I explain how to perform Propensity Score Matching in R. The module covers the complete PSM workflow, including propensity score estimation, nearest neighbor matching, balance assessment, treatment effect estimation (including ATE and ATT), and practical examples using fully reproducible R code.
The Statistics Globe Hub is an ongoing learning program focused on practical skills in statistics, data science, AI, and programming with R and Python.
More information about the Hub: statisticsglobe.com/hub
#RStats #RProgramming #DataScience #Statistics #CausalInference #Analytics #StatisticsGlobeHub

Wub Y retweeted

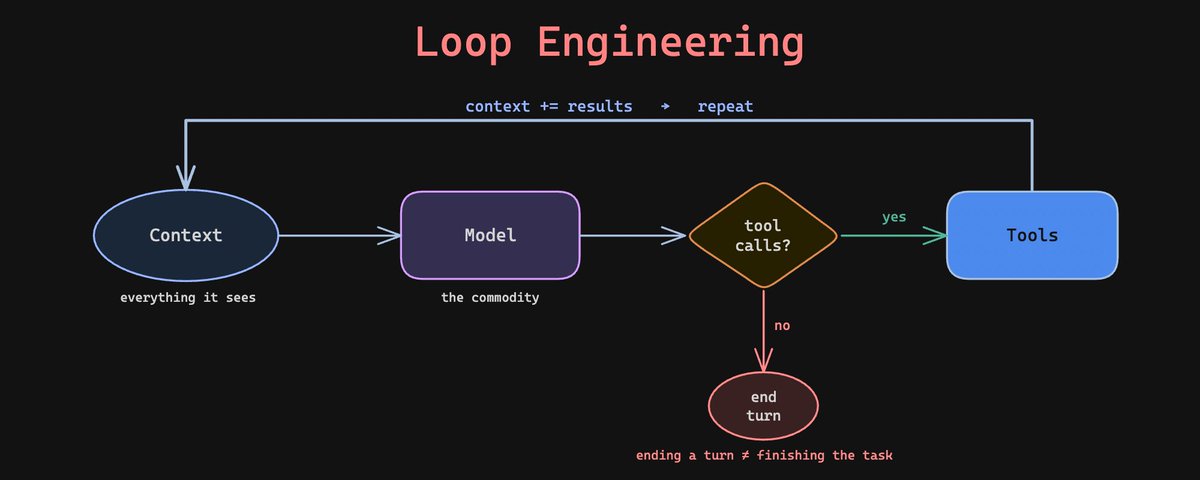
the four types of agent loops.
loop engineering keeps getting talked about as one thing. it's actually a choice between four structures, and each one fits a different kind of task.
it means designing the system that steers the agent, instead of steering it yourself move by move.
that system always answers two questions. what starts a run, and what decides the work is done.
in a hand-run session you answer both yourself, every single time. each loop type moves more of that into the system.
here's each type, what triggers it, and when to reach for it.
1) turn-based.
triggered by a user prompt. the agent gathers context, acts, and checks its work inside a single turn, then a human reviews the output and writes the next prompt.
use this when requirements are still forming and every output changes what you'd ask for next.
2) goal-based.
triggered by a /goal command carrying success criteria and a budget, like "get the homepage Lighthouse score to 90, stop after 5 tries." when the agent tries to stop, an evaluator model checks whether the goal is met, and a no sends it back to work.
use this when the outcome is measurable but the path there isn't worth your attention.
3) time-based.
triggered by a clock. an interval fires, the agent runs a fixed prompt like "check the PR, fix CI," then waits for the next tick. /loop runs on your machine, /schedule moves it to the cloud so it survives a closed laptop.
use this for recurring work where the task is known in advance and only the timing repeats.
4) proactive.
triggered by an event or schedule with no human present. a routine watches a channel, and when something needs handling it spawns a workflow with a triage agent, a fix agent, and a reviewer that adversarially judges the work before the task closes.
use this for standing responsibilities where you can't predict what will come in, only that something will.
each type hands off one more job than the last. turn-based keeps both with the human, goal-based automates the checking, time-based automates the trigger, and proactive automates both while deciding the workflow shape at runtime.
so the mapping question isn't which loop is most advanced. it's whether your task is exploratory, measurable, recurring, or standing.
the more you hand off, the less you babysit.
I wrote the full breakdown on loop engineering. the article is quoted below.

Wub Y retweeted
Most machine learning models try to predict outcomes. But what if your goal is simply to detect observations that look unusual?
That is exactly what the Isolation Forest algorithm is designed for.
Isolation Forest is an unsupervised machine learning method for anomaly detection. Instead of learning what is normal and flagging deviations afterward, it directly tries to isolate unusual observations in the data.
The key idea is surprisingly intuitive: Normal observations are similar to many others and therefore harder to isolate, whereas anomalies are rare and different, so they tend to be isolated very quickly through random data splits.
Some important advantages of Isolation Forest include:
🔹 efficient even for large datasets
🔹 works well with high-dimensional data
🔹 no target variable required
🔹 relatively fast training process
🔹 robust for many anomaly detection tasks
🔹 can detect unusual patterns automatically
This makes Isolation Forest especially useful for tasks such as fraud detection, network security, sensor monitoring, data quality checks, unusual customer behavior, and outlier detection in large datasets.
The figure below illustrates the general concept of anomaly detection. The unusually high spikes and the flat segment may both indicate anomalous behavior in the data. Image source Wikipedia: en.wikipedia.org/wiki/Isolat…
Note: Detected anomalies should always be interpreted carefully, since unusual observations may either represent data problems or contain highly valuable information. For this reason, observations flagged by algorithms such as Isolation Forest should not automatically be removed from a dataset without careful investigation and domain-specific interpretation.
If you are interested in more content like this, you may subscribe to my newsletter for regular insights on statistics, data science, AI, and programming with R and Python.
Take a look here for more details: statisticsglobe.com/newslett…
#R #datascienceenthusiast #RStats #Statistics #database #Data

Wub Y retweeted
K-means is one of the most widely used clustering techniques in data science and machine learning. A key part of the algorithm is convergence, the process where cluster centers and point assignments gradually stabilize through repeated updates. Knowing how and why convergence happens helps ensure reliable and meaningful clustering results.
✔️ Converges quickly on most data sets, making it efficient for large-scale problems
✔️ Offers a simple and interpretable structure for identifying groups
✔️ Scales well to large data sets due to its low computational complexity
❌ Results depend heavily on initial cluster placement
❌ Can misrepresent structure if features are not properly scaled
❌ May produce empty or unstable clusters if not configured correctly
To support consistent convergence:
🔹 Use k-means++ to start with smarter center positions
🔹 Apply feature scaling to avoid dominance by larger-scale variables
🔹 Set suitable values for the iteration limit and convergence threshold
The image illustrates the K-means convergence process. Data points are assigned to the closest center based on squared distance. After assignment, each center is recalculated as the average of its assigned points. These steps repeat until the center positions no longer change meaningfully. Credit for the visualization: en.wikipedia.org/wiki/K-mean…
For regular insights on practical statistics, data analysis, and how to apply them in R and Python, join my newsletter.
For more information, visit this link: statisticsglobe.com/newslett…
#coding #RStats #datasciencetraining

Wub Y retweeted
Principal Component Analysis (PCA) is a crucial technique for reducing the dimensionality of data sets while preserving their essential features.
By converting original variables into a new set of uncorrelated principal components, PCA captures the most significant variance in the data, simplifying analysis and visualization.
Implementing PCA in Python is straightforward using the PCA class from the sklearn.decomposition module. This module efficiently computes the principal components and summarizes their importance. For visual insights, the matplotlib and seaborn libraries can be used to plot the results.
Steps to Implement PCA in Python:
1️⃣ Load Data: Import your data set with pandas functions like read_csv() or read_excel().
2️⃣ Standardize Data: Use StandardScaler from sklearn.preprocessing to standardize the data, ensuring each feature contributes equally to the PCA.
3️⃣ Perform PCA: Apply the PCA class from sklearn.decomposition to calculate the principal components.
4️⃣ Analyze Results: Examine the variance captured by each component with explained_variance_ratio_ and visualize using matplotlib and seaborn.
For a detailed, step-by-step guide to performing PCA in Python, including practical examples, check out my tutorials created in collaboration with Paula Villasante Soriano & @Cansu_SG.
Article: statisticsglobe.com/principa…
Video: youtube.com/watch?v=JXtISpdD…
Additionally, I have developed an extensive online course on PCA, which covers both the theoretical concepts and practical applications. The course includes detailed instructions on implementing PCA in the R programming language, another popular tool for PCA analysis.
Click this link for detailed information: statisticsglobe.com/online-c…
#datavis #DataAnalytics #database #programming

Wub Y retweeted

spopt, an R package for spatial optimization, is now in general release on CRAN.
spopt-r is inspired by the Python package of the same name. Features include:
- Regionalization algorithms for building contiguous districts / territories;
- Facility location solvers;
- Route and fleet optimization solvers;
- Optimized corridor routing on cost rasters;
- The classic Huff model for market analysis;
- Pathways for using open-source routing engines like R5 and OSRM.
Solvers are written in C++ and Rust so they run fast.
Get started: walker-data.com/spopt-r


Wub Y retweeted

𝗙𝗼𝗿 𝘁𝗵𝗲 𝗳𝗶𝗿𝘀𝘁 𝘁𝗶𝗺𝗲 𝗶𝗻 𝗵𝗶𝘀𝘁𝗼𝗿𝘆, 𝗮𝗴𝗿𝗶𝗰𝘂𝗹𝘁𝘂𝗿𝗮𝗹 𝗳𝗶𝗲𝗹𝗱 𝗯𝗼𝘂𝗻𝗱𝗮𝗿𝗶𝗲𝘀 𝗵𝗮𝘃𝗲 𝗯𝗲𝗲𝗻 𝗺𝗮𝗽𝗽𝗲𝗱 𝗮𝘁 𝗴𝗹𝗼𝗯𝗮𝗹 𝘀𝗰𝗮𝗹𝗲.
I've been collaborating with the Fields of the World (FTW) organization for over a year through Taylor Geospatial and it's finally released publicly in cloud storage for anyone to use, at no cost.
Wub Y retweeted

Where are you?
Each role focuses on a specific part of the data lifecycle.
1️⃣ Data Engineers — build pipelines, databases, data tools
2️⃣ Data Scientists — statistics, ML models, experiments, inference
3️⃣ Machine Learning Engineers — model training, deployment, MLOps
4️⃣ Data Analysts — dashboards, reporting, business insights
5️⃣ Core Focus — turn raw data into useful decisions or products
#datascience #dataengineering #machinelearning #dataanalyst #mlengineering #ai


Wub Y retweeted
Missing data is a common issue in data analysis, and there are several approaches to handle it depending on the data structure and analysis requirements. Each method has its advantages and limitations, and choosing the right one is crucial for ensuring the accuracy and robustness of your results. Below, you can find some popular methods to handle missing data.
1️⃣ Listwise Deletion
This method removes rows with missing values entirely. While it simplifies analysis, it can lead to a significant loss of data, reducing sample size and statistical power. If the data is not missing completely at random (MCAR), listwise deletion is likely to introduce bias into the analysis, potentially distorting results.
2️⃣ Single Imputation
Single imputation methods, such as regression imputation or predictive mean matching, replace missing values with a single plausible estimate. These methods are straightforward to apply but do not account for the uncertainty associated with missing values.
3️⃣ Multiple Imputation
Multiple imputation addresses the limitations of single imputation by creating several plausible imputed data sets. The results from these data sets are then combined, providing a more robust approach that accounts for the variability introduced by missing data.
The attached image illustrates the structure of missing values in a data set, with missing values shown in red and observed values in blue. Understanding the patterns and extent of missing data, as shown in this visualization, is a crucial step before deciding on the best handling method.
For a detailed explanation of these methods and when to use them, watch my video tutorial published some time ago on the Data Professor YouTube channel. In the video, I explain the differences between listwise deletion, single imputation, and multiple imputation with practical examples in R programming: youtube.com/watch?v=oPFs-lOL….
Looking to master missing data methods? Check out my online course Missing Data Imputation in R. See this link for additional information: statisticsglobe.com/online-c…
#RStats #datastructure #R #DataScience


Wub Y retweeted
Celebrating 2025 CSU-TAPS Full & Limited Irrigation Track Winners! Top teams' management decisions throughout the season made the winning difference, from efficient and timely irrigation and nitrogen use to engaged marketing. Check them out here:
tinyurl.com/msabzcb5

Wub Y retweeted

Literature review - day 1
Readers added context they thought people might want to know
Olayın yaşandığı yer Brezilya'nın São Paulo şehridir.
Arkadan geçen otobüslere bakıldığında da bunların São Paulo şehrindeki toplu taşıma araçlarının renklerine ve desenlerine sahip olduğu görülmektedir.
x.com/grok/status/20…
reddit.com/r/oddlysatisfy…
Otobüslerle ilgili kanıtlar:
en.wikipedia.org/wiki/Trolleybu…
mobilidade.estadao.com.br/mobilidade-par…
Wub Y retweeted

Experts speak on artificial intelligence in Ag as Colorado Farm Show gets underway in Greeley trib.al/4yjh9Bl


Wub Y retweeted


Event Update: KSU-TAPS Awards Banquet
Due to forecasted snowfall and dangerously cold temperatures, we’ve made the decision to postpone the KSU‑TAPS Awards Banquet in the interest of everyone’s safety.
New Date: Saturday, February 21, 2026
Same time & location as originally planned
We truly appreciate your understanding and apologize for any inconvenience. We’re looking forward to celebrating this year’s TAPS results and participants together under safer travel conditions.
Plan ahead: Registration is now open for the new date.
RSVP here: bit.ly/4rbewoM
More reminders and updates will be shared as we get closer. In the meantime—please stay safe and warm.
#TAPSNetwork #KSUTAPS
