

Greg Capra is known as a pioneer of online investing and trading. Started trading in the late 80s. In 1994, he began educating investors and traders.
Joined March 2010
- Tweets4.6K
- Following62
- Followers2.6K
- Likes211




Pinned Tweet
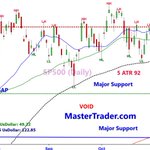
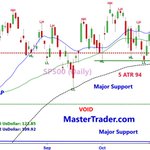
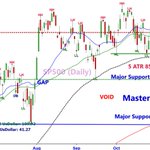
Trendlines are often a misleading form of trend analysis, and this chart actually illustrates why.
There is no single “correct” way to connect diagonal price points, because those connections are subjective and inconsistent.
Different analysts can draw different lines on the same chart and reach completely different conclusions. If one trendline doesn’t work, another is drawn.
Projecting those diagonal lines into the future as if they define trend direction, trend breaks, or meaningful support and resistance lacks logical grounding. Price does not respond to imagined diagonal boundaries.
At Master Trader Technical Strategies, we focus on what price actually respects — horizontal price levels, where real transactions occurred, and where supply and demand were previously proven. That is where markets make decisions.
Diagonal trendlines may serve as a loose “visual aid” reference, but when they become the basisfor conclusions or forecasts, they obscure the real message of price rather than clarify it.
No End of Year Rally? | Join the Pre-Market Review - Master Trader Green Room teapawt.net/i/broadcasts/2rJqVRmyy…

SPX Extremes for today. The broader markets and gapping a bit higher this morning, with that is doing little to neutralize the damage done last week. When markets moved too far too fast in the short, “Price Voids” and countertrend moves or normal. How far they get will tell us whether last week’s collapse was a one-day event or the start of a larger move lower. MasterTrader.com

$XLI, $VLTO - While scanning last week’s carnage, I opened the Industrial sector ETF (XLI) to examine both sides of the selloff: stocks breaking down with the sector and those showing relative strength.
Within that sector list, I scanned for stocks with “stacked” moving averages in bullish alignment. One that caught my attention was Veralto Corporation (VLTO). mastertrader.com/this-stock-…
But finding a bullish stock doesn’t automatically mean you’ve found a good entry.
Let’s walk through what the chart tells us—and what still needs to happen #StockMarket #SwingTrading #TechnicalAnalysis #MarketAnalysis #DayTrading

Micron Technicals Versus Fundamentals and the Risk of Buying a Falling Knife
Micron may have a compelling long-term business story. That does not automatically make its stock a compelling purchase today. The daily chart here mastertrader.com/technicals-… shows why investors should evaluate the business and price action together before committing capital.
AI demand, strong cash generation, and a low estimated price-to-earnings ratio can put a stock on a watchlist. A broken price structure tells us to be patient. At Master Trader, we want evidence that buyers are gaining control and a setup that allows us to define risk. A lower price alone provides neither. #StockMarket #SwingTrading #TechnicalAnalysis #MarketAnalysis #DayTrading


QQQ 0DTE Credit Spreads | Live Trading in the Master Trader Green Room teapawt.net/i/broadcasts/2zkArnmnK…

Mini Crash - Was it a Low? Join Friday's Premarket review and Market Bias teapawt.net/i/broadcasts/2dKLRkOOg…

SPX Extremes for today. Yesterday, I said that the put strike increased significantly and may be a sentiment extreme. After yesterday, the opposite has occurred, and the put strike fell over 500 points. The last few days: price action driven by short covering, the fear of missing out, and getting all in, followed by yesterday’s realization that maybe the Democratic sweep wasn’t such a good thing.
Markets experienced the mini-crash, and moves like this don't end quickly without considerable consolidation and/or continued moves lower. The five-day average true range rose to 170, which is extreme and raises the odds of range contraction and lower short-term volatility. MasterTrader.com

Rally to Resistance - What’s Next? Join Thursday's Premarket review and Market Bias teapawt.net/i/broadcasts/2BlLrknJK…

SPX Extremes for today. The S&P 500 is at a significant resistance area. How it reacts will tell us a lot about the coming days. The put strike rose by 120 points; the call strike by only 10. Bearish sentiment decreased significantly. So far, today's high-volume call strike expiring today is $7930, and the high-volume put strike is $7600. The high open-interest call strike is $7930, and the high open-interest put strike is 7550. Tech continues to be under selling pressure.

Election Results are IN! Join Wednesday's Premarket review and Market Bias teapawt.net/i/broadcasts/2YRnyzOBq…

SPX Extremes for today. The strikes significantly increased higher based on the market’s gap up. However, the gap is into resistance that places prices back to the trading range. Semis and AI stocks are lower.

Election Day Trades - Join Tuesday's Premarket review and Market Bias teapawt.net/i/broadcasts/2WXKrpErv…

SPX Extremes for today. The strikes dropped significantly from the previous day, and that’s expected after yesterday’s down move. Markets are rebounding a bit premarket. With the election results still pending, today may be choppy. Watch for the JOLTS report at 11 o’clock, which may move the market. #Options, #Credit Spreads, #Options Trader, #master trader, #Income Trade
