

Quantitative market research / Data-driven Analysis. Historical stats support a thesis - they don’t replace one. Not investment advice. DYOR.
Germany
Joined May 2024
- Tweets639
- Following81
- Followers1.6K
- Likes930



HB Research retweeted
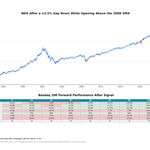
Since 1987, the Nasdaq 100 has opened at least 2.5% lower while still above its 200-day moving average on 14 occasions.
small sample

Since 1987, the Nasdaq 100 has opened at least 2.5% lower while still above its 200-day moving average on 14 occasions.
small sample
HB Research retweeted

20% of S&P 500 stocks above the 50 day moving average also occurred in December 2024, 2 months before a major top. Out of the 2 cases, the current case is more similar to December 2024 than to March 2026 because of the minimal decline in SPX price.
teapawt.net/RyanDetrick/status/210…


HB Research retweeted
One month later, the S&P 500 was higher in 30 of 36 historical cases (83%), with an average gain of 2.7%.
Not a long-term bullish signal!

One month later, the S&P 500 was higher in 30 of 36 historical cases (83%), with an average gain of 2.7%.
Not a long-term bullish signal!
HB Research retweeted
Only 25.4% of S&P 500 stocks are currently above their 50-day moving average.
That is unusually weak short-term breadth beneath an index still near all-time highs.

Only 25.4% of S&P 500 stocks are currently above their 50-day moving average.
That is unusually weak short-term breadth beneath an index still near all-time highs.
HB Research retweeted
Bond-market volatility is rising sharply.
The MOVE Index has surged 33% over the past two trading days.
(MOVE is inverted)

Bond-market volatility is rising sharply.
The MOVE Index has surged 33% over the past two trading days.
(MOVE is inverted)
HB Research retweeted
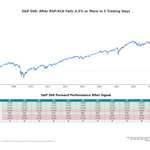
The S&P 500 has historically performed well over both short and long horizons after RSP/XLK fell at least 4.5% in five trading days.
Recent signals have clustered near all-time highs, even with a 21-trading-day cooldown.

The S&P 500 has historically performed well over both short and long horizons after RSP/XLK fell at least 4.5% in five trading days.
Recent signals have clustered near all-time highs, even with a 21-trading-day cooldown.
HB Research retweeted

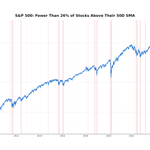
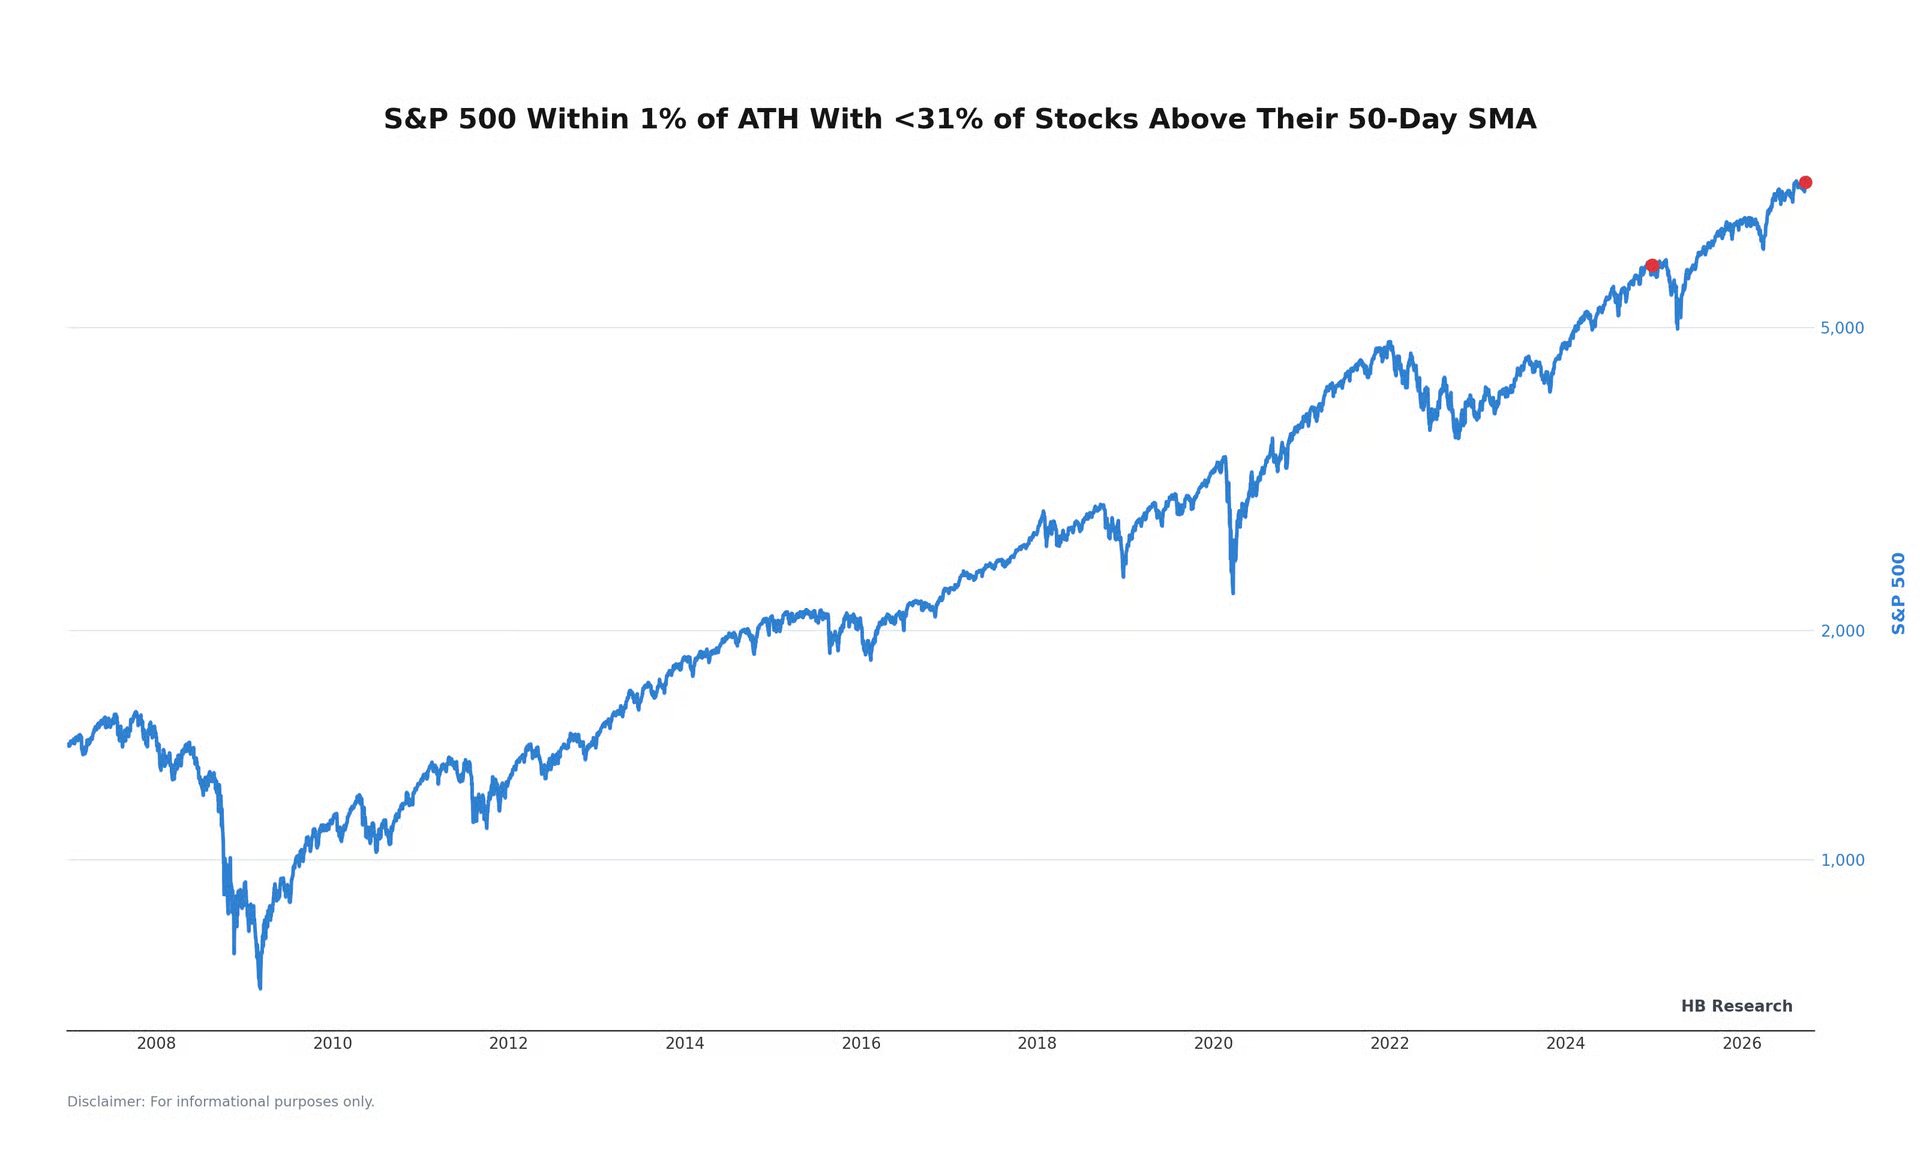
"Breadth looks unusual. The S&P 500 is within 1% of its all-time high, yet fewer than 31% of its stocks are above their 50-day SMA. Since late 2006, this has occurred on only two prior trading days, both in December 2024."
@HBResearchX
HB Research retweeted
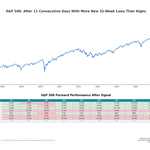
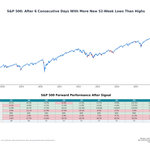
Unusual breadth: More S&P 500 stocks have hit new 52-week lows than highs for over 6 straight sessions, despite the index being near ATH.
After the sixth day, short-term returns were mixed. At 6 and 12 months, 16/17 cases were positive, averaging +11.2% and +21.3%.

Unusual breadth: More S&P 500 stocks have hit new 52-week lows than highs for over 6 straight sessions, despite the index being near ATH.
After the sixth day, short-term returns were mixed. At 6 and 12 months, 16/17 cases were positive, averaging +11.2% and +21.3%.

HB Research retweeted
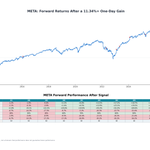
Yesterday, Meta posted its 11th-biggest daily gain: +11.34%.
Similar jumps saw positive returns in 9/10 cases after both 2 and 6 months, and 10/10 after 12 months.
April 2022 was the only loser at both 2 and 6 months.

HB Research retweeted
Breadth looks unusual.
The S&P 500 is within 1% of its all-time high, yet fewer than 31% of its stocks are above their 50-day SMA.
Since late 2006, this has occurred on only two prior trading days, both in December 2024.

Yesterday, Meta posted its 11th-biggest daily gain: +11.34%.
Similar jumps saw positive returns in 9/10 cases after both 2 and 6 months, and 10/10 after 12 months.
April 2022 was the only loser at both 2 and 6 months.
Breadth looks unusual.
The S&P 500 is within 1% of its all-time high, yet fewer than 31% of its stocks are above their 50-day SMA.
Since late 2006, this has occurred on only two prior trading days, both in December 2024.
HB Research retweeted

A good rule of thumb in bull markets:
Don't fade bullish signals.
By definition, they should work.
Is it guaranteed? Of course not. Nothing is.

