

Gold alpha provider for those who listen. Deleted my main account after the be kind brigade cancelled me.
Joined March 2018
- Tweets7.2K
- Following429
- Followers3K
- Likes2.8K





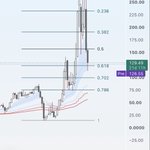
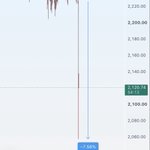
Copper miners are cooked. Distributing for 8 months. So hard to predict when charts like this finally slide and give up the ghost, but when this one does the key monthly ema’s are currently 30% away. It’s my hedge for my gold mining positions. Longing counter-cyclical, shorting cyclical.


This is exactly what you would expect as liquidity turns.
Btc is a honest gauge of risk and risk appetite has fallen off a cliff. No one wants to play.
Tech is bouncing violently from oversold conditions and the S&P has put in a daily cycle low and benefits from short squeezes in tech. Everyone wants to play mean reversion.
In a bear market for risk you expect huge equity squeezes and a crypto slow bleed.

I refuse to fucking believe,
That $BTC will not follow SP500s recovery.
Very disappointing to see SP500 recover half of its entire drop while BTC has done absolutely nothing.
Even I’m starting to feel it.

1
27
1,853
Should have mentioned @CerlogicFounder as another non-gold bug trader with a sharp eye on gold here. He’s superb. Clean eye on commodity markets in particular. Unbiased, unemotional, follows the trend.
4
18
1,477
Gold probably has not formed its intermediate cycle low yet, but I think by December the gold royalty majors will already be at all-time highs. They have a good sense where things are going and are front-running gold. And are printing cash.
Three monster patterns. Royal Gold, Franco Nevada, and Wheaton Precious Metals charted vs gold.
$RGLD $FNV $WPM


Royal Gold now gapping up to the highs. Only 7% off.
A lot of people will be chasing these names next year on ATH breakouts

1
3
569

With the exception of @Tom__Capital and @LSDinmycoffee my timeline is completely silent on gold. Very odd.
These oversold bounce days on AI are distracting people from the massive moves on the same days in miners.
I think a lot of traders are too focused on the gold and silver charts and are not paying enough attention to the mining equities.
Oil and energy equities look topped. That capital will rotate fast into gold miners.


Have finished full porting into precious metals plays. The cycle timing isn’t perfect but gold did enough of a pullback. -28%. It broke 4000 and reclaimed that massive range. Silver did -60%, broke 50, and reclaimed. Those are huge levels. If silver makes new lows it’s cooked, and the equities are now leading. Gold miners are insanely strong and believe that’s it.
Look at $SIL with a massive cup and handle and descending wedge. Or $GDX. Or the royalty majors like $FNV or $WPM.
These charts are absolutely bonkers on the HTF and are now showing LTF breakout moves.
These are your new market leaders.


I see a lot of people fighting the tape longing crypto and ai.
Guys. Preserve your capital. The liquidity cycle has turned. Just wait for better days.
6
59
3,192
A good rule of thumb is that anyone up 4,500% is a scammer.

And now in the green circle before panic.

Where Are We In The Sentiment Cycle?
The sentiment cycle is a timeless pattern from Justin Mami’s book from 1999, which describes the phases and behavior of a normal market cycle.
Because the market moves in repeatable cycles, with similar characteristics as the cycle progresses.
And they are repeatable because the market is a product of human behavior such as fear, greed, panic and complacency.
Long time readers of TSF will recognize this one, and that we have used it before in two complete market cycles.
The tariff decline and recovery and the Iran war decline and recovery. Here we see what we mapped out before the Iran war decline.
And we have to ask ourselves, where are we now, look carefully at the schematic, and then look at the current price action.
My guess is as good as yours, but I would say looks pretty much like subtle/overt warning to me.


Huge relative strength from gold miners on a day gold and silver were down.
New leadership potential.

2
38
1,948
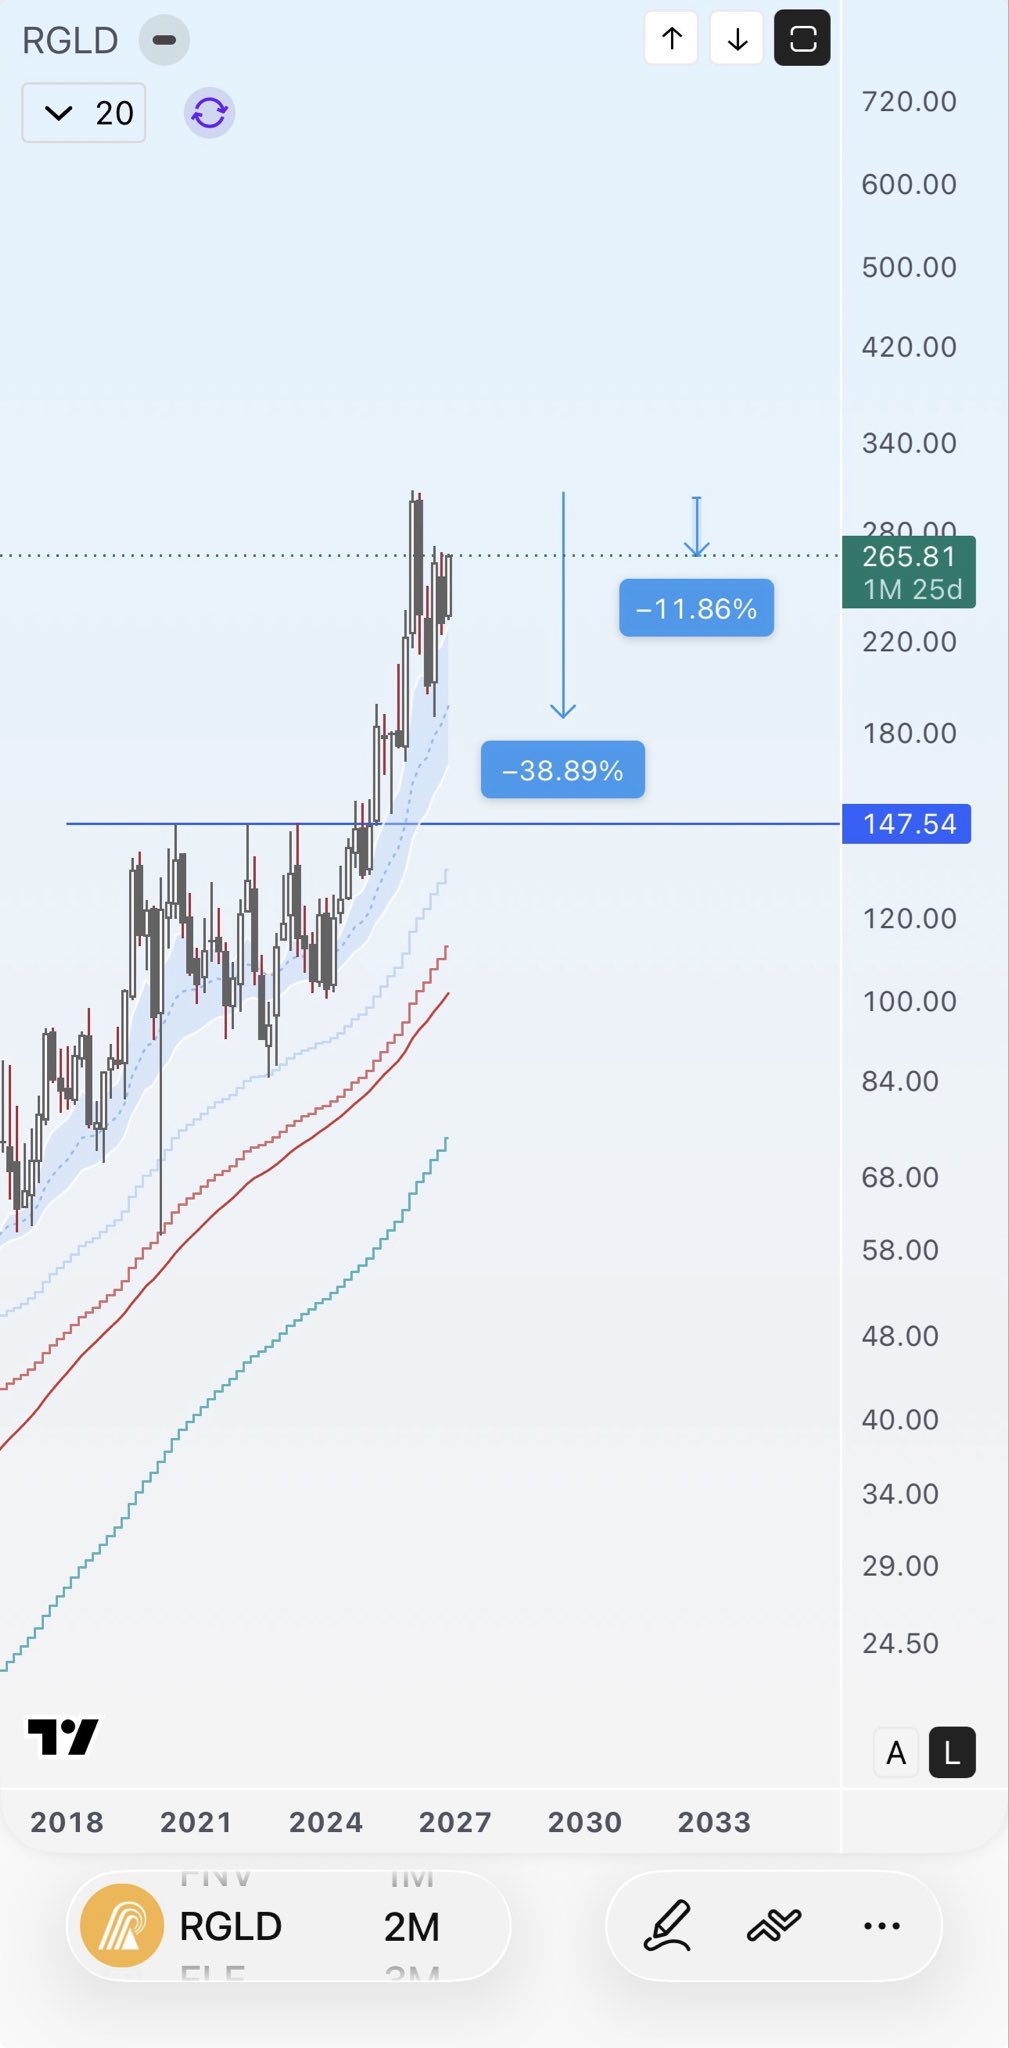
Look at a chart like Royal Gold on the higher time frames (2M). Tight consolidation after a 40% pullback. Now only 10% off the highs.
Terrible mistake on my part not buying back in earlier because I was watching the gold chart, not paying attention to this. These producers and royalty plays are ludicrously undervalued.
Study this.
This is how someone with spreadsheets and Claude but zero understanding of markets thinks.
“I have fundamentals skills! I am good at dealing with fundamentals! Can't you understand that? What's wrong with you people?!"


the great semicon reset this week
has opened up juicy opportunities we didn't have just a few months ago. let me articulate some thoughts.
intel's stock has been cut hard, down 46% over the past 3 months.
the bull case for $INTC is that better manufacturing economics can turn Intel's product growth into much higher earnings.
- lip-bu tan says a couple of outside foundry customers could be ready to announce within two quarters.
- 18A (intel's newest chip process) costs are down 40% since Q1
- 18A chips went from <5% to nearly 1/3 of client CPU revenue
- wildcat lake, the cheap 18A laptop chip, grew units 70% q/q and is sold out
- data center revenue is on track to end 2026 ~$10B above what intel expected going in
CFO's rule of thumb: 40 to 60% of any new revenue falls through to gross profit
cheaper wafers plus more revenue on the new node is operating leverage. 2027 is when it should show. the CFO already calls next year a growth year.

6
1,169
I sold all crypto on Thursday because we closed below the closing low of the last daily cycle low, setting up the potential for a deeply left-translated broken daily cycle with a daily cycle high at day 6. That could get seriously ugly with a full two months of time for a decline.
The DCL on 10/15 for me is confirmed with a higher higher and a close above the 10 and 20 MA's. We don't have confirmation of a broken cycle until we break 79,821 but I want nothing to do with these markets in any way, shape, or form.
BTC could easily roundtrip this entire move and head back to 68k in its sleep.
Have fun.

And there’s your day 6 Daily Cycle High confirmation. This now had loads of time to bleed lower, all the way into December.

1
6
463