

Understand the positioning. Question the consensus. Find the edge.
Chennai
Joined July 2026
- Tweets200
- Following1
- Followers1.4K
- Likes121




We just got smarter. We can now almost say, with decent probability, where the straddle price can close.
To back this up, here’s the statistical evidence: hedgewall.in/research/hr-006…
Today is the last day to avail the 7-day trial. Get your hands dirty with us.

4
652


8/9
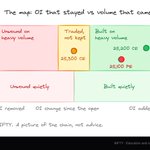
At the last close, NIFTY, 42 options on screen:
21 built on heavy volume 9 traded, not kept 6 unwound on heavy volume
Top 3 strikes held 42% of the day's VOLEX. Busiest: the 25,100 put.
A description of the chain. Not advice.

1
183
9/9
Open the pane called "OI · ΔOI × VOLEX" in the Hedgewall workspace. Chart = the map. Table = every option with its numbers.
Try Hedgewall free for 7 days. Free trial to be expired on 16th Nov
👉 hedgewall.in
#Nifty #OptionsTrading

201
1/
We tested Hedgewall’s Unusual volume flag: 20,101 bursts, 435 NIFTY sessions.
A burst is a step of about a minute that trades 4x the option’s own average per minute today, at least the step’s median volume, and at least Rs 3.5 Cr a minute.
Does it spike? Which side initiated?

6/
Does the gap hold up? Seller-led minus buyer-led, on (share of bursts where open interest rose minus share where it fell).
Overall +34 percentage points (90% range +31 to +37, resampling whole days).
2025 +38, 2026 +31. Calls +36, puts +32. Expiry days +28, other days +36.

1
101

Hedgewall retweeted

This is exactly why I built Hedgewall.
Look at the Sensex 81600, 81700 and 81800 PE strikes.
We're seeing unusually large volumes in these contracts, almost 800 to 900 points ITM. And this isn't random noise worth ignoring.
Today was a market holiday. With tomorrow's opening expected around these strikes, this kind of activity becomes particularly interesting.
Now, most traders would probably never bother looking this deep ITM. But that's precisely where some interesting positioning clues can sit.
@Hedgeewall flagged this in its Unusual Volume tab. No digging through hundreds of strikes, no manually scanning option chains.
These are the nuances I wanted Hedgewall to uncover.
Because sometimes, the most interesting information in the market isn't where everyone is looking. It's hiding in places most people don't bother looking at.
19 months of building, and honestly, seeing these things come alive on the platform is incredibly satisfying.

The biggest open interest on the option chain is not always the wall.
A wall follows gamma exposure, not OI alone
youtu.be/1wTyA-aE1W0?si=UgJk…

686