





ALT Summary of a survey from KFF highlighting that about 1 in 5 large firms cover GLP-1 drugs for weight loss, often with restrictions like participating in a lifestyle program or meeting with a clinician.

ALT Blue quick fact graphic from KFF with white text. It says, “Total annual premiums for employer-sponsored family health coverage average $28,303 in 2026. Workers on average contribute $7,471 toward the premiums, with the employer paying the rest. Source: KFF Employer Health Benefit Survey, 2026.” Above the text, there is an emphasis on “$28,303” with bolded text.

ALT Read KFF’s new issue brief: Assessing Ability to Work: How Historical SNAP Processes May Vary from Medicaid


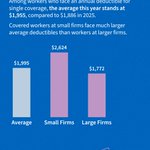
ALT KFF graph showing average deductibles for single coverage: $1,995 on average, $2,624 for small firms, and $1,772 for large firms.

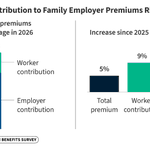
ALT A KFF chart titled "Workers’ Contribution to Family Employer Premiums Rise 9% in 2026." The left side shows average annual premiums for family coverage in 2026: $28,303 total, with $7,471 as the worker's contribution and $20,833 as the employer's contribution. The right side displays the percentage increase since 2025: 5% for total premium, 9% for worker contribution, and 3.7% for worker earnings.

ALT A KFF chart titled "Workers’ Contribution to Family Employer Premiums Rise 9% in 2026." The left side shows average annual premiums for family coverage in 2026: $28,303 total, with $7,471 as the worker's contribution and $20,833 as the employer's contribution. The right side displays the percentage increase since 2025: 5% for total premium, 9% for worker contribution, and 3.7% for worker earnings.

ALT The KFF image has a purple background with text that reads, "Issue Brief: What Could Medicaid Work Requirements Mean for People with Disabilities Waiting for Medicare Coverage?"

ALT About Half of Parents Mistakenly Believe Spacing Out Vaccines Is Healthier for Children; Half Say No Strong Evidence to Support Such a Claim. The chart shows response rates from U.S. adults, including parents, about which answer comes closest to their view, even if neither is exactly right: “Children are healthier when their vaccines are spaced out and they don’t get multiple shots in one visit” or “There is no strong evidence that spacing out vaccines or avoiding multiple shots in one visit is healthier for children.”

ALT The KFF pie chart shows the distribution of annual spending on State Directed Payments (SDPs) for nursing home services. The total spending is $3.7 billion, with 59% ($2.2 billion) coming from federal sources and 41% ($1.5 billion) from state sources. The chart is from KFF and includes a note about state submissions to CMS.

ALT KFF chart titled "Majorities of Parents Across Partisanship Are Confident in MMR and Other Long-Standing Vaccines for Kids; Large Partisan Divides Over COVID-19 Vaccines". It displays percentages of confidence in vaccines: MMR (78%), Polio (76%), Hepatitis B (75%), Flu (67%), and COVID-19 (42%). The data is divided by political affiliation: Democrats show higher confidence than Republicans in each category.

ALT About Half of Parents Mistakenly Believe Spacing Out Vaccines Is Healthier for Children; Half Say No Strong Evidence to Support Such a Claim. The chart shows response rates from U.S. adults, including parents, about which answer comes closest to their view, even if neither is exactly right: “Children are healthier when their vaccines are spaced out and they don’t get multiple shots in one visit” or “There is no strong evidence that spacing out vaccines or avoiding multiple shots in one visit is healthier for children.”

ALT Map of the United States titled "Eight States Have Relatively Generous Guaranteed Issue Protections on an Either Continuous or Annual Basis." The map shows states with expanded protections (green) and those that exceed federal standards (purple). The other states, highlighted in blue, offer protections on either a continuous or annual basis. States with only federal minimum standards are in gray. A key provides information on the protection categories. The KFF logo is in the bottom corner.

ALT The image is an informational graphic by KFF. It states, "Nearly 3 in 4 enrollees in Medicare Advantage have a pre-existing medical condition that could trigger a denial for a Medigap policy if they switch to traditional Medicare and seek supplemental coverage." There are three filled blue circles and one empty circle above the text. The source is also noted at the bottom.