

Slay the Patriarchy! 🐻❄️
Somewhere on the East Coast
Joined March 2017
- Tweets26K
- Following438
- Followers1K
- Likes30K




kay retweeted

Talk to God about it, he hears you, humbly ask him, if you are who you say you are can you please help & show me the way, have faith & be still. Sometimes he removes everything & everyone away from you to get your attention so you have no one to put your trust in but him.
kay retweeted

The NY Times has the receipts today. Here's how the Nvidia Blackwell chip laundering worked.
1. Nvidia was blocked from selling Blackwell chips to China. So Jensen Huang sold them to Alice Huang at Megaspeed which installed them in data centers in Singapore, Malaysia, and Indonesia.
2. Howard Lutnick's family and company (Cantor Fitzgerald) were also heavily invested in these southeast Asian data centers and Lutnick blocked regulatory enforcement against Nvidia.
3. The data centers then either sold compute to China or hollowed out the servers and shipped the Blackwell chips directly to China. (Reports of hollowed out servers are from others on X, not in the articles.)
4. Nvidia could claim correctly that they had not shipped Blackwell chips to China. But the Megaspeed middlewoman (Alice Huang) was clearly facilitating Chinese access.
5. The Trump administration has known this for a year. Jensen Huang and President Trump were eager to sell Blackwells to China so they opposed the restrictions and didn't seem to mind the circumventions of the embargo. Secretary Rubio seems to be the main character within the administration trying to enforce the law.
It is also true that no one can run Nvidia other than Jensen Huang. So we are left in the unfortunate position where the CEO of the most important tech company in the world messed up and now the stock is going to crater and lots of people won't be able to retire because their stock portfolio just got nuked.
nytimes.com/2026/11/14/techn…
nytimes.com/2026/11/15/us/po…

kay retweeted

$QQQ weekly prediction THIS COUOD BE CRAZY
Monday: Red to green
Tuesday: green
Wednesday: REALLY GREEN
Thursday: RED
Friday: Chop/red
We have NVDA earnings the first one without Jensen, and anthropic IPO. This week should be extremely crazy on tech. whether my prediction pans out or not I will always trade on my 10 toes ready to adjust anything!
kay retweeted

Market Wizard Linda Raschke's 12 Technical Trading Rules
1. Buy the first pullback after a new high. Sell the first rally after a new low.
2. Afternoon strength or weakness should have follow‑through the next day.
3. The best trading reversals occur in the morning, not the afternoon.
4. The larger the market gaps, the greater the odds of continuation and a trend.
5. The way the market trades around the previous day’s high or low is a good indicator of the market’s technical strength or weakness.
6. The previous day’s high and low are two very important “pivot” points, for this was the definitive point where buyers or sellers came in the day before. Look for the market to either test and reverse off these points, or push through and show signs of continuation.
7. The last hour often tells the truth about how strong a trend truly is. “Smart money” shows their hand in the last hour, continuing to mark positions in their favor. As long as a market is having consecutive strong closes, look for the up‑trend to continue. The up‑trend is most likely to end when there is a morning rally first, followed by a weak close.
8. High volume on the close implies continuity the next morning in the direction of the last half‑hour. In a strongly trending market, look for resumption of the trend in the last hour.
9. The first hour’s range establishes the framework for the rest of the trading day.
10. A greater percentage of the day’s range occurs in the first hour than was the case in the past, and thus it has become increasingly important to trade aggressively if there are early signs of a strong trend for the day.
11. There are four basic principles of price behavior which have held up over time. Confidence that a type of price action is a true principle is what allows a trader to develop a systematic approach.
The following four principles can be modeled and quantified and hold true for all time frames, all markets. The majority of patterns or systems that have a demonstrable edge are based on one of these four enduring principles of price behavior. Charles Dow was one of the first to touch on them in his writings.
Principle One: A Trend Has a Higher Probability of Continuation than Reversal
Principle Two: Momentum Precedes Price
Principle Three: Trends End in a Climax
Principle Four: The Market Alternates between Range Expansion and Range Contraction
In the world of money, which is a world shaped by human behavior, nobody has the foggiest notion of what will happen in the future. Mark that word – Nobody! Thus the successful trader does not base moves on what supposedly will happen but reacts instead to what does happen.

kay retweeted

Here is how I approach shorting, I am very selective with it and don't short often, but when I do I try to lean in to make it count.
And being selective with timing is key in shorting, the market is biased long which is important to keep in mind.
1. First I want a downtrend, I only short assets in a short term downtrend
2. I want to identify zones of confluence of resistance, and I want price to confirm that this resistance matters
3. I want to short weakness after testing said resistance, and I want to use leverage to take advantage of the moves, because when shorting I cover quick, most often the same day
4. I don't short the first test of resistance, I want to watch if we get a subsequent test that wicks lower like both $QQQ and $IWM did before they tanked. Preferably price hovers close to resistance 2-3 days on lower volume before breaking down.
5. I don't short strength, I short weakness within strength in a downtrend. Meaning I short on loss of daily AVWAP or 15 or 30 min opening range break down
6. I personally like to short the indices, the risks with shorting is unlimited loss, because any stock can gap up an unlimited amount. Indices can always squeeze me as well but there's a limit to the move.
And I never overstay my welcome in shorts, very aggressive profit taking is essential.


I don't short often but I enjoy it when I see an opportunity. Shorted $QQQ yesterday in this confluence of resistance, covered 1/3 see what the rest brings. Market is crap and prone to weakness, recognize a crappy market when you see one


kay retweeted
MOST REQUESTED VIDEO EVER: Fair Value Gaps!
FVGs explained, the FULL breakdown. 17 minutes of your time to learn a concept that will change the way you look at the market.
Once I started using Fair Value Gaps my profitability increased drastically. I can NEVER guarantee results for others, no concepts guarantee any profits, however FVGs give me a clear framework for TA that has made the market much clearer for me.
Enjoy, this is a Gabe's Gauntlet course ATG exclusive!
kay retweeted

How do you tell a countertrend rally from the start of a new market uptrend?
One strong green day doesn't mean the correction is over.
During corrections, some of the biggest rallies happen inside downtrends. That's why confirmation matters more than the size of the bounce.
Here are the 5 things I look for:
1. Follow-Through Day (FTD)
A strong index gain on higher volume, typically on Day 4 or later of a rally attempt. It suggests institutional buying may be returning.
2. Market Breadth
A healthy rally should see more stocks participating, not just a handful of mega-cap names lifting the indexes.
3. Leading Stocks
Watch whether fundamentally strong stocks reclaim key moving averages, break out of constructive bases, and hold their gains.
4. Volume Confirmation
Up days should attract stronger volume while pullbacks come on lighter volume. Repeated heavy-volume selling is a warning sign.
5. Higher Highs and Higher Lows
A sustainable uptrend gradually builds higher highs and higher lows instead of repeatedly failing at resistance.
One important point: Even a follow-through day doesn't guarantee a new bull market. Some fail, especially when leadership and breadth remain weak.
For me, the real test comes after the initial rally.
Do leading stocks hold their gains? Does the market absorb its first pullback without breaking recent lows? Are more stocks joining the advance?
A countertrend rally can look impressive for a few days. A sustainable uptrend proves itself over time.
You don't need to catch the exact bottom or sell at the exact top. Capturing a meaningful portion of a sustained uptrend is what matters.
🤖 Made with AI

kay retweeted
How do you know when the market has bottomed? You don’t guess. You look for signs.
Yesterday:
- $QQQ reportedly fell 6.5% on almost 3x normal volume.
- $VIX reportedly jumped 70%, one of its largest one-day gains in history.
Most people either panic sell here or try to catch the exact low. Neither one is a plan.
These are the 5 signs I look for:
1. Capitulation Volume
A huge down day on heavy volume, when forced selling accelerates and investors rush for the exits.
2. Fear Spikes
The VIX jumps and the headlines turn ugly. Bottoms often form when fear is at its highest.
3. Selling Slows
Down days get smaller and selling volume starts to dry up. Fewer stocks keep making new lows.
4. Leaders Hold Up
Watch which stocks refuse to make new lows while the index does. Those are often the next leaders.
5. Follow-Through Day
A rally attempt starts, the Day 1 low holds, and on Day 4 or later, an index posts a strong gain, typically 1.25%+ on higher volume. That signals a potential new uptrend, although follow-through days can fail.
Where we are now:
✅ 1. Capitulation Volume
✅ 2. Fear Spikes
⬜ 3. Selling Slows
⬜ 4. Leaders Hold Up
⬜ 5. Follow-Through Day
Signs 1 to 4 tell you a bottom may be forming. Sign 5 provides confirmation of a rally attempt, not a guarantee that the bottom is in.
Corrections are where watchlists get built. Track who’s holding up, and wait for the market to confirm.
Bookmark this. I’ll update the checklist as each sign shows up.
🤖 Made with AI

kay retweeted
If QQQ hits $660 in November NQ 27.2kish, and shows clear signs of buyers/defense there: I will be buying 3-5% OTM $QQQ calls for 12/18 and 1/15/2027 with HEAVY HEAVY size
I won’t remind you all of this again. It will be a high risk trade but a risk I’m fine taking. NFA
kay retweeted

Halloween in New York City is unmatched! 🎃 Tonight’s Village Halloween Parade was incredible!
Huge thanks to Jorge, Todd & @thrillernyc for another spectacular Michael Jackson THRILLER finale!
One of NYC’s greatest traditions! 🧟♂️🗽 – at New York, NY
kay retweeted

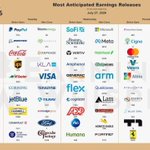
#earnings for the week of November 2, 2026
earningswhispers.com/calweek
$AAPL $PLTR $AMD $DIBS $APP $AEHR $QCOM $AMC $SHOP $MRNA $SMCI $TXG $UBER $LITE $COHR $CHKP $KTOS $NVTS $ANET $FSLY $AAOI $BMRN $VSH $NET $OKLO $DOCS $TEM $PFE $CIFR $EL $CAVA $RIOT $BKNG $TEAM $NVO $ABNB $ETN $BXSL $MPC $FN $GFS $DDOG $MP $U $IREN $FISV $BROS $RUN $ALAB $ARM

ALT The most anticipated earnings releases for the week of November 2, 2026, are Apple #AAPL, Palantir Technologies #PLTR, Advanced Micro Devices #AMD, 1stDibs #DIBS, AppLovin #APP, Aehr Test Systems #AEHR, Qualcomm #QCOM, AMC Entertainment #AMC, Shopify #SHOP, and Moderna #MRNA.
kay retweeted

Tech Stocks in Bear Market Territory:
1. AppLovin, $APP: -65%
2. CoreWeave, $CRWV: -57%
3. Coinbase, $COIN: -56%
4. Western Digital, $WDC: -52%
5. Oracle, $ORCL: -50%
6. Arm Holdings, $ARM: -49%
7. Circle, $CRCL: -44%
8. Sandisk, $SNDK: -42%
9. Robinhood, $HOOD: -40%
10. Seagate, $STX: -39%
11. ServiceNow, $NOW: -37%
12. Super Micro Computer, $SMCI: -35%
13. Intel, $INTC: -35%
14. Adobe, $ADBE: -34%
15. Broadcom, $AVGO: -31%
16. Marvell Technology, $MRVL: -30%
17. Alphabet, $GOOGL: -28%
18. IBM, $IBM: -25%
19. Micron, $MU: -24%
20. Meta, $META: -22%
We are in a "stealth" bear market.
Read our analysis below.


kay retweeted
When to buy the dip?
Buy dips in uptrends. Avoid them in downtrends.
In a Stage 2 uptrend, price makes higher highs and higher lows above a rising 200-day SMA. Pullbacks on lighter volume toward rising moving averages often attract buyers, as those averages can act as support.
In a Stage 4 downtrend, the opposite happens. Price makes lower highs and lower lows, while rallies toward declining moving averages often face selling pressure. What once acted as support can become resistance.
A stock trading below a declining 200-day SMA might look cheap, but cheap can always get cheaper.
Before buying a dip, look for:
- Price above a rising 200-day SMA
- Higher highs and higher lows
- Pullbacks on lighter volume toward rising moving averages
- Signs of buyers stepping in at support
The goal isn’t to buy a stock simply because it’s fallen. It’s to buy strength during temporary weakness.
Buy the pullback in an uptrend, not the breakdown in a downtrend.
🤖 Made with AI

kay retweeted

Next week is gonna be a blockbuster 🤯
Earnings: $MSFT $GOOGL $AMZN $SKHY $NOW $INTC $SNDK $TWLO
Economic: FOMC, Jobless Claims, PCE, GDP
Weekend geopolitical risks: US–Iran war, Russia–Ukraine war.
Between Big Tech earnings, the Fed, inflation data and everything happening geopolitically, we're heading into one of the most event-packed weeks in a while.
Get ready for some volatility.


kay retweeted

AI predictions for next 6-9 months
-> Anthropic/ OAI fail to ban OSS in the US
-> Anthropic/ OAI continue to innovate product but stall on fundamental tech breakthroughs
-> SOTA Gemini 4 launches at 10x lower cost
-> Elon open sources Grok
-> Anthropic/ OAI ARR growth stalls as enterprises move from tokenmaxxing to rational token consumption/ OSS
-> slow realization in public markets that AI may not replace human labor in next 1-3 years/ has not had a fundamental tech breakthrough in over a year/ lacks ROI/ AI hyper and lab spend not durable
-> moonboy VCs/ hedge funds/ softbank continue to fund Anthropic/ OAI equity raises in private markets as public markets for them are now fully closed
-> CXMT, YMTC announce capacity expansions significantly above market expectations
-> hypers deliver good q326 results on first look but fail to show meaningful AI ROI, guide to "significant capex expansion in fy27"
-> broad realization in public markets the AI dream we got sold on is not anywhere close to realization
-> 10yr hits >5%
-> hyper bonds reprice >10%, CDS hit 3x current levels, and AI credit market dries up as market realizes GPU ABF was not a good idea
-> hyper equities reprice 30-50% lower
-> ORCL falls below $30 as rumors of bailout make the round
-> market realizes memory is cyclical and LTAs won't hold
-> 50% of korean traders get wiped within a week
-> hypers cut fy27 capex
-> semis reprice >80% lower
-> fed cuts >150bps to avoid recession