Marcus Weather Mapping - status and updates
Joined June 2020
- Tweets206
- Following41
- Followers49
- Likes1
Due to a problem between NOAA and the VHP science team (?) we've added MODIS 16 day NDVI/EVI (and percentage of normals) to Marcus Weather Mapping (MWM) as temporary replacement for STAR - Global Vegetation Health Products, which are currently stuck on 2024 - week 25.

1
46
Majority of key Argentinian growing areas expected to be drier than normal for Jan, 2023 - see Percentage Normal Precipitation map below...

2
292
We've added Daily and Monthly Sea Surface Temperature Satellite Imagery to our mapping application - MWM. Recorded, Departure From Normal and Date Comparison variables are all available.


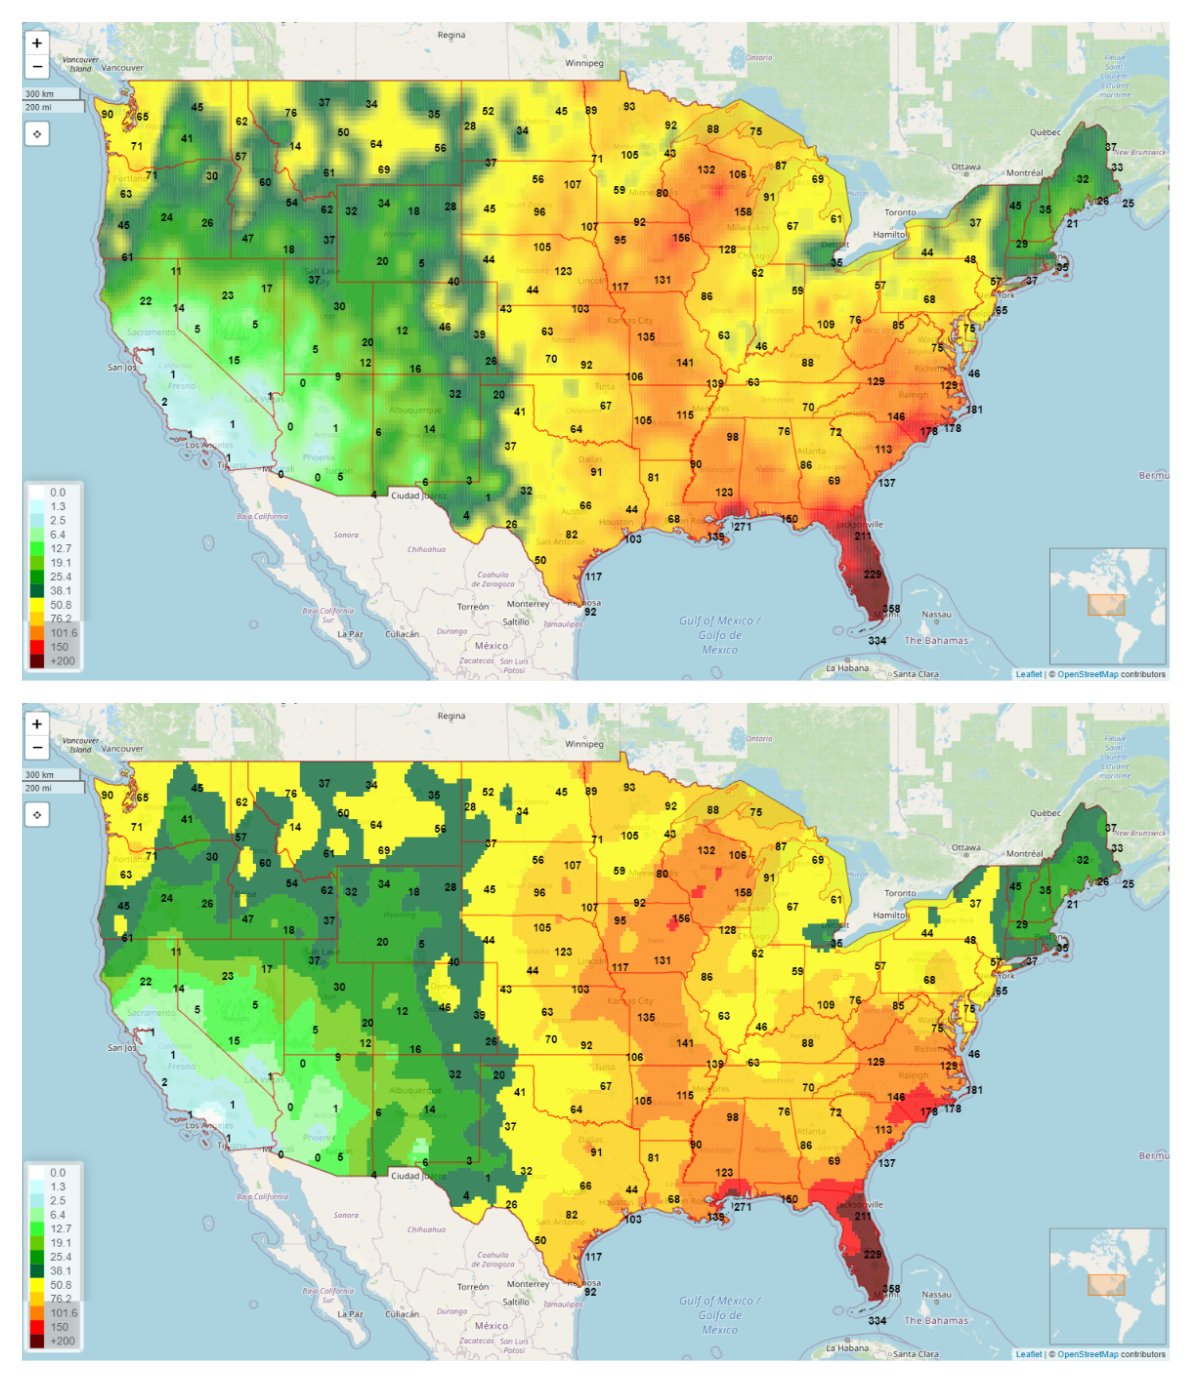
We've added a new satellite image variable - super high resolution Total Precipitation - 1 day, 7 day and 14 day totals

Secondary Mapping inserts are now available on our static Automapping daily reports, see this example: Total Precipitation Forecast Comparison Tool (FCT) for the main map, Total Precipitation forecast from previous day as insert

We've added a whole range of new Satellite Image based variables: Percentage of Normal for NDVI, VHI, VCI, TCI, Surface Soil Moisture, Subsurface Soil Moisture and Departure from Normal for Soil Temperature and Subsurface Soil Temperature - see Sur-Soil Moisture % Normal below

The Satellite Imagery Comparison Tool is now available. This tool allows you to compare one satellite image to another, displaying the difference between the two. If comes in two modes - color change and Improve/Deteriorate View


1