

Futures Trading Community Since 2020 | Live Education & Strategy
Monster Lab
Joined February 2024
- Tweets550
- Following10
- Followers5.8K
- Likes581
Thanks for reading. 🧪
PO3 First FVG Lite is private and free. Claim yours on Whop, the only place to get it:
whop.com/monsterlab
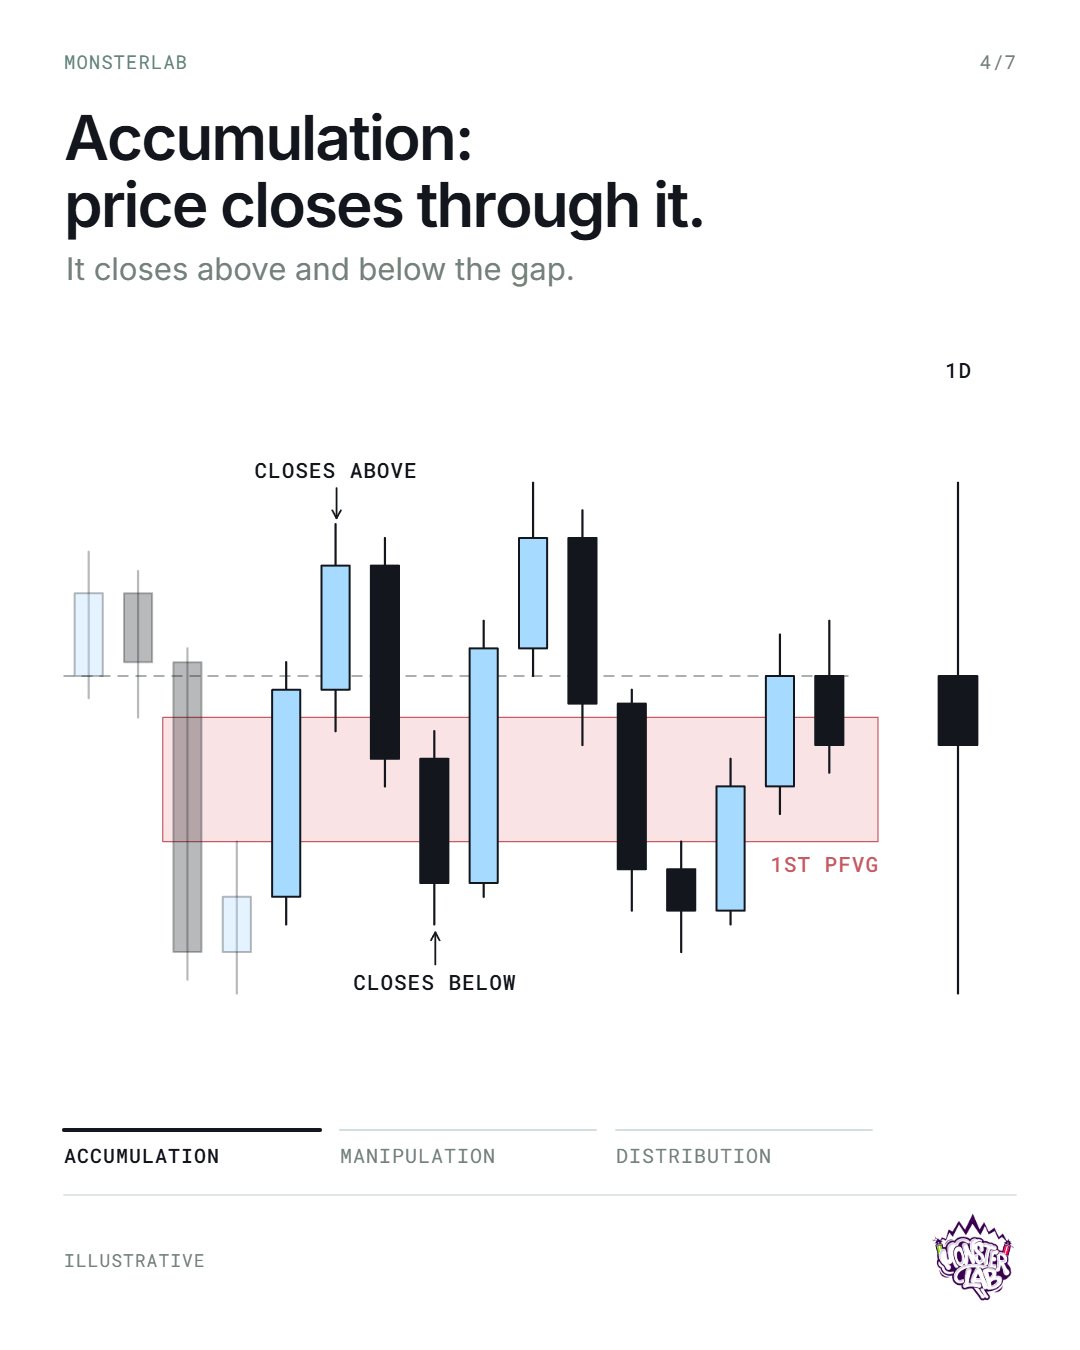
Chart is illustrative, not output from the indicator.

Same first gap, one level down.
The 1H opens and its first gap prints on M1.
If it holds with a target in play, price can keep distributing toward −2 / −2.5.
If price closes above and below it, the hour may be accumulating.

Distribution: in this bullish example, a clean close above the gap.
Then a quick re-accumulation inside it.
Same gap through all three phases. Price just treats it differently in each one.

Manipulation: price rejects the gap.
An opposite wick into it, then a body that closes beyond it.
From there, price can sweep into −2 / −2.5 standard deviations, measured from the 1 and 0 on the chart. A zone to anticipate.

Accumulation: price closes through the gap.
A close above it. A close below it.
That two-sided closing is what accumulation looks like around the first gap.

It starts at the PO3 open.
Count from the candle that opens at xx:00, not the one before it. That holds on any timeframe.
The first displacement after the open leaves the first gap.

