

BECCS, Biomass and CCS Researcher / Tyndall Centre for Climate Change Research / University of Manchester / #BECCS 🌾♻️🪨=🗺️
Joined February 2012
- Tweets39
- Following42
- Followers34
- Likes54



🌱 Exploring BECCS supply chains in the UK with digital twin modelling.
🗻Track1&2 vs dispersed chains
⚡Energy & fuel security
🌿Biomass competition
BECCS critical for net-negative emissions (UK Biomass Strategy)
#BECCS #biomass #SustainableEnergy #CCS #digitaltwin

1
83
Day 31
A map showing the cooperative deployment of three BECCS-Power facilities within the Humber ICCS Cluster, maximising local biomass utilisation and minimising transportation costs within 50km 🤝
#MapMay #BECCS #CCS #Humber #NetZero #ClimateChange #EnergySecurity

172
Day 30
Maps showing the UK's offshore geological storage sites with current licenses for carbon storage and those with licences offered for application 🪨
#MapMay #CCS #Storage #Subsurface #NetZero #ClimateChange

2
191
Day 29
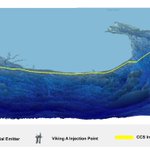
3D block map of the emitters within the Viking ICCS cluster storing CO2 offshore in the North Sea 🏭
#MapMay #VikingCCS #NetZero #ClimateChange #CCS #Humber

1
209
Day 28
Swine manure distribution map for 2022 🐷
#MapMay #Biomass #Bioenergy #NetZero #ClimateChange #Pig #SustainableFarming

1
155
Day 27
Maps showing the same 1MtCO2/yr BECCS-Power facility in the Black Country cluster, where one uses diesel propelled rail and the other uses green hydrogen propelled rail (optimising produced emissions) 🚂
#MapMay #BECCS #Rail #NetZero #ClimateChange #FreightRail

119
Day 26
Map showing the CCS integration pathways for all of the UK's industrial emitters without devolved administration cooperation, leading to some areas seeing a 1258% increase in transport costs 💰
#MapMay #CCS #Devolution #NetZero #ClimateChange

99
Day 24
3D map of the integration pathways for the emitters within the London ICCS cluster storing in the North Sea via the Viking cluster 💂
#MapMay #London #VikingCCS #NetZero #Shipping #ClimateChange #CCS

130
Day 23
Maps showing the CCS integration pathways for all the UK's industrial emitters, where one uses heavy fuel oil propelled shipping and the other uses green ammonia propelled shipping 🚢
#MapMay #CCS #Shipping #NetZero #ClimateChange

1
119
Day 22
A map showing the same 1 MtCO2/yr BECCS-Power supply chain, where one has 100% biomass availability (no competition for biomass) and the other has 10% biomass availability (high competition for biomass) 🌱
#MapMay #Biomass #Bioenergy #BECCS #Competition #energysecurity

128
Day 21
Distribution map of the UK's potential salt cavern storage sites for short to medium term hydrogen storage 🗺️
#MapMay #Hydrogen #NetZero #ClimateChange #EnergyStorage

2
107


Day 18
Map showing the CCS integration pathways for all of the UK's industrial emitters using a mixture of pipeline and non-pipeline transportation methods under a fossil fuel regime, including the newly announced Peak Cluster⛰️
#MapMay #CCS #NetZero #Energy #Transportation

106
Day 17
Sheep manure distribution map for 2022 🐑
#MapMay #Biomass #Bioenergy #NetZero #ClimateChange #Sheep #Wales

1
1
125


Day 14
3D map of the integration pathways for the emitters within the South Wales ICCS cluster storing in the East Irish sea
#MapMay #SouthWales #SWIC #NetZero #ClimateChange #CCS

111
Day 13
Rapeseed straw spatial distribution map from 2016 to 2022 🌿
#MapMay #Biomass #Bioenergy #NetZero #Biofuel
1
103