

🚚 We’ve moved! This account is no longer active. For the latest climate news and resources, follow @NASAEarth or visit https://xitter.cf/t.co/EYapdO7MId
- Tweets7K
- Following97
- Followers325K
- Likes466


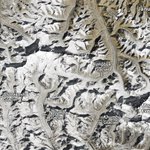


ALT Landsat 9 image of the Rwenzori Mountains. Dark-green vegetation lies on the mountain flanks and transitions to more barren, brown land at higher elevations. Small patches of white snow and ice are visible on the tallest peaks. A network of thin brown rivers is visible to the left and right of the mountains.

ALT A detailed view of the Rwenzori Mountains, centered in the scene, shows the range's three highest mountains: Mount Stanley, Mount Speke, and Mount Baker. The peaks are topped with white, much of which is snow.


ALT Graph showing sea ice extent in millions of kilometers in 2025. Purple lines show Antarctic sea ice. It dips and hits an annual low around February and March, then rises to hit a peak around September and October. A green line shows Arctic sea ice, which peaks around March and dips around September to October. At the top is a group of blue lines showing global total sea ice, which dips around March and has two peaks around June and November. Lighter color lines show more recent years, which are much lower than the older, darker years for each of the lines.


ALT A photograph of two fully fabricated flat polarimeter samples. Metasurfaces could become the foundation for future, ultra-light instruments, including space-based polarimeters. Credit: Capasso Group


ALT Globe centered on the Pacific Ocean. The west coast of North America is barely visible on the top right and Australia on the bottom left. The globe shows sea surface height anomaly in centimeters. Blue indicates a negative anomaly and yellow, orange and red indicate a positive anomaly. There is a dark blue band along the equator and patches of red and orange above it and at the very bottom of the globe.

ALT A shallow pool of water over a cracked valley floor underneath a cloudy sky. Photo credit: NPS / Kurt Moses
