

NetWeave is a Digital Marketing agency and AI consultancy that helps companies build their business by connecting with their customers.
- Tweets40.4K
- Following5.4K
- Followers14.8K
- Likes571




ALT A skeleton sitting at a desk with a laptop displaying a login screen. The area is decorated with cobwebs and a small pumpkin. Crumpled papers are scattered across the desk, and a lantern is visible in the background.

ALT A festive Halloween scene featuring carved pumpkins with glowing faces, spider webs, and a lantern. The full moon illuminates bats flying in the night sky. The words "Happy Halloween" are prominently displayed.

ALT Engagement line graph comparing Facebook, Instagram, LinkedIn, YouTube & TikTok, and other paid social from January 10 to 31. Facebook shows a significant peak around January 27. Below, a table displays total engagements of 26,042 with a 446.4% increase. Reactions, comments, shares, post link clicks, and other post clicks are listed with substantial percentage increases. Engagement rate per impression increased by 92.9%, reaching 6.6%.

ALT Children joyfully running and playing on a grassy field with trees in the background.

ALT An ornate vintage telephone with a rotary dial sits on a wooden surface next to a modern smartphone.

ALT A skeleton sitting at a desk with a laptop displaying a login screen. The area is decorated with cobwebs and a small pumpkin. Crumpled papers are scattered across the desk, and a lantern is visible in the background.


ALT A skeleton dressed in a checkered shirt and puffy vest stands with hands on hips, surrounded by people. Text above reads: "Client: I want to buy followers. Social media manager:


ALT A skeleton dressed in a checkered shirt and puffy vest stands with hands on hips, surrounded by people. Text above reads: "Client: I want to buy followers. Social media manager:

ALT A cartoon showing a scientist with wild hair yelling, "I don't care if your phone's on 1%, this charger is for the monster!" A creature resembling Frankenstein's monster lies on a table, connected to a charger, while another character holds a phone looking concerned. Various lab items are visible in the foreground.

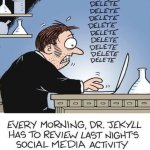
ALT A person with a surprised expression types on a laptop. The word "delete" is repeated several times above the laptop. There are laboratory equipment in the background. The text reads, "Every morning, Dr. Jekyll has to review last night's social media activity.

ALT A packaged Halloween costume labeled "Social Media Manager" from Spirit. The display features a skeleton wearing glasses, a striped tie, and using a computer keyboard. The text humorously lists features like "explaining to your team yet another Gen Z trend" and "Canva premium subscription.

ALT An ornate vintage telephone with a rotary dial sits on a wooden surface next to a modern smartphone.

ALT A skeleton sitting at a desk with a laptop displaying a login screen. The area is decorated with cobwebs and a small pumpkin. Crumpled papers are scattered across the desk, and a lantern is visible in the background.

ALT A skeleton dressed in a checkered shirt and puffy vest stands with hands on hips, surrounded by people. Text above reads: "Client: I want to buy followers. Social media manager: