

Grounded economic and business analysis for an uncertain world | [email protected]
Canada
Joined August 2026
- Tweets114
- Following23
- Followers13
- Likes357





Pinned Tweet
Odunomic Advisory
Independent Economic Research
For professional inquiries:
[email protected]
🤖 Made with AI

When Concentrated Investment Reverses: Mapping the Systemic Links
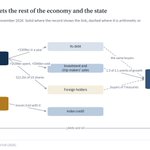
The assumption that concentrated investment in chips and infrastructure will remain contained during a contraction ignores the mechanics of the broader system. As mapped in the first diagram detailing system links, this specific sector currently accounts for roughly 1.3 of 2.1 points of recent economic growth. A deeper pullback here does not just isolate tech; it directly reaches broader growth and federal tax receipts at the exact same time. Treating these as separate risks misses their shared exposure, a critical oversight given that this combined weight would fall on a bond market that has functioned as a weaker shelter since 2022.
The accompanying pathways matrix maps the strict arithmetic of how a one-fifth contraction would travel through the global system.The initial impact moves directly through global trade. A cut of a fifth in builder spending removes $138 billion a year from the system, measured against chip makers' yearly sales of $789 billion. Because this type of investment represents 8.7% of US GDP, the proportional loss in exports would carve out 7.8% of GDP in Malaysia, 6.8% in Taiwan, and 1.9% in Korea.
Beyond physical supply chains, the capital contraction introduces a severe sovereign stress test. A parallel fall of a fifth in US share prices would erase $5.0 trillion for foreign holders, including $0.53 trillion held directly by foreign states. This dynamic would heavily test the dollar, delivering proportional economic losses equivalent to 58% of GDP for Kuwait, 34% for Singapore, and 32% for Norway.
Ultimately, this exposure forces a systemic debt repricing. The five largest builders currently owe $848 billion in debt and leases, and with project bonds already trading below face value, arranging banks are increasingly left holding unsold supply. This culminates in the final pathway where the broader market joins the decline. Following the 2000 tech bust, US federal receipts fell from 19.8% to 15.4% of GDP over four fiscal years. A similar drop today means the two halves of the market move in tandem, forcing a strained bond market to absorb surging issuance at the precise moment it lacks the capacity to serve as a reliable cushion.
Evaluating these outcomes as isolated fractures fundamentally misprices how the transmission mechanism operates across the global economy.


War, Oil and Debt
The world economy in November 2026, and what its calm rests on
War with Iran has disrupted global oil supplies, reignited inflation, reversed the direction of interest rates, and pushed government bond yields to decade highs. Yet financial markets remain remarkably calm, even as strains begin to emerge in global equities.
What is sustaining this calm, and how durable is it?
Our latest research examines the foundations of this apparent resilience and the risks building beneath it.
KEY FINDINGS:
INFLATION OFFERS TEMPORARY DEBT RELIEF
Rising prices have reduced the real burden of government debt, but this benefit fades as existing debt is refinanced at higher interest rates.
GOVERNMENT BORROWING COSTS ARE RISING
Renewed inflation and tighter monetary policy have pushed sovereign bond yields to their highest levels in more than a decade across much of the developed world.
FINANCIAL RISKS HAVE SHIFTED ONTO PUBLIC BALANCE SHEETS
Some apparent stability reflects the transfer of debt and risk to governments rather than their disappearance.
TRADITIONAL MARKET PROTECTION HAS WEAKENED
Government bonds have frequently failed to offset equity losses, reducing their effectiveness as a refuge during inflation-driven shocks.
MARKET CALM CONCEALS EMERGING PRESSURES
Credit markets remain relatively stable, while equity declines in Asia and technology sectors suggest that financial strains are beginning to surface.
War, Oil and Debt
Global Risk Intelligence · Research Report
Odunomic Advisory | Macro Research | November 2026
#OdunomicAdvisory #OdunomicResearch #GlobalRiskIntelligence #GeopoliticalRisk #Oil #Inflation #SovereignDebt #BondMarkets #FinancialStability #GlobalEconomy


The AI Bubble Popped. The Market Just Hasn't Noticed Yet.
The AI bubble has already quietly popped, though the broader market remains trapped in the bargaining stage of grief. Acceptance will come eventually. The real story right now, however, requires looking past the serene facade of the headline indices.
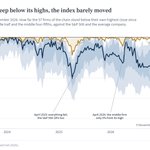
The "old world" economy continues to hold the water level artificially high. Through wars, oil shocks, and a fierce sell-off in government bonds, the surface has barely rippled. For nearly two years, the S&P 500 has floated within a breath of its all-time highs, projecting an image of invincibility.
Strip away that top layer and a vastly different reality emerges. A critical chain of 57 companies, the very firms tasked with building, powering, and funding the data center revolution, is quietly sinking. On the exact same day the broader market stood at its zenith, the median firm in this AI supply chain had already lost 41% of its value.
This unwinding is both steady and remarkably wide. Eight in ten of these infrastructure companies are down at least a fifth from their peaks, and a third have been cut entirely in half. Industry heavyweights like Oracle, Micron, and SK Hynix have surrendered massive ground, while CoreWeave and Blue Owl have watched more than 60% of their peak valuations wash away.
Plotting these two worlds together reveals a stark structural divergence. The brass line of the S&P 500 glides smoothly across the top, leaving the AI chain to give way entirely.
Such a severe disconnect did not happen overnight. When the AI sector stumbled in the spring of 2025, it dragged the rest of the market down with it in a highly correlated drawdown. They fell together, and they recovered together.
The last seven months have introduced a completely different regime. The AI supply chain has now plunged further than it did a year ago, yet this time around, the broader market has largely ignored the carnage.
The surface remains perfectly still. The foundation is cracking.


Investment in information equipment and software now accounts for 8.7% of US GDP, approaching its 9.1% peak in 2000. Over the past four quarters, this investment contributed 1.3 percentage points to real GDP growth of 2.1%, before accounting for imports. Because much of the spending on chips and servers goes toward imported goods, its net contribution to domestic growth is smaller.
Nevertheless, the strength of this investment matters for the trajectory of federal debt, which currently stands at 121% of GDP. At that level, a one percentage point reduction in nominal GDP growth would raise the debt-to-GDP ratio by approximately 1.2 percentage points over a year, all else equal, even before considering changes in borrowing costs.

The market decline of 5 November spread across global markets, although its timing differed by region. Because Asian markets had already closed before the selloff in New York, their movements are assessed across that session and the following trading day.
South Korea recorded the steepest decline at 11.0%, followed by Japan and Taiwan, both down 7.6%. European losses were more moderate, with Germany falling 2.3%, Italy 1.9%, and the UK 1.4%, while France and Spain remained largely unchanged. India stood out, gaining 4.8%. By 9 November, New York had recovered some of its losses, leaving the S&P 500 just 1.8% below its pre-decline close. South Korea, however, remained 11.0% below its previous level at its latest available close on 6 November.

Bank stocks have weakened across several major economies, with France, Brazil and the UK recording some of the largest declines.
Banks are also performing worse relative to their domestic stock markets in countries with higher sovereign risk readings. This pattern has become more pronounced in recent months.
The figures show how banking performance varies across countries and how closely it is linked to sovereign conditions.


The Gold Vote
Gold is at an inflation-adjusted record in 152 of 189 currencies. In dollars and pounds, it stands at 1.9 times its 1980 peak.
The usual explanations don't hold up. Across the G20, inflation, real interest rates and debt levels look nothing alike, yet real gold sits at a record in 17 of 19 countries. The dollar is strong, not weak. And since the Fed began hiking in 2022, gold's sensitivity to real yields has lost about two-thirds of its force.
So if it isn't inflation, rates or the dollar, what is gold responding to?
The Gold Vote follows the trail back a century: to a remedy that quietly disappeared in 1934, and to a choice made during the last inflation that changed who pays for public debt. What gold is pricing turns out to be far bigger than this cycle.
🔐 Read the full piece: [odunomic.substack.com/p/the-…]

How do periods of market division end?
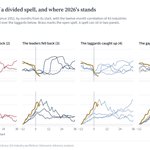
Since 1952, US industry divides have followed four paths: a common shock, falling leaders, recovering laggards, or persistent gaps.
Our analysis of 43 industries compares these episodes, with market correlation above and the leaders’ lead over laggards below. The current spell, shown in brass, began with a 98 percentage point gap, the widest at the start of any of the spells since 1950.
Electrical equipment, computers and steel were among the leaders, while medical equipment, business supplies and business services lagged. By August 2026, the gap remained at 101 percentage points.
All four historical paths remain possible, with no clear indication yet of how the current divide will resolve.
World Markets Together, US Industries Apart
US Equities • Cross-Asset • Research Note
Odunomic Advisory | Macro Research | October 2026
#MacroResearch #USEquities #CrossAsset #MarketBreadth #Energy

Is the World Moving On From the Dollar?
It is difficult to say with certainty, but there are reasons to believe that we may already be in the early stages of a prolonged transition in the global monetary order. The current system has endured for more than five decades, and history suggests that major changes in monetary arrangements often unfold over many years before a new order becomes firmly established.
Something unusual began in 2022. As the Federal Reserve raised interest rates to contain inflation, US real yields rose sharply. Ordinarily, this should have weighed heavily on gold, since higher inflation-adjusted returns on government bonds make holding an asset that pays no interest less attractive. By September 2026, real yields had risen by approximately four percentage points, a movement that, based on their historical relationship, should have reduced gold’s inflation-adjusted value by 71%. Instead, gold appreciated by 92%, reaching 5.1 times the level implied by that relationship.
A comparison with 1980 is particularly revealing. Gold’s extraordinary rise then occurred amid inflation of 14%, when US federal debt stood at just 31% of GDP. By February 2026, inflation was around 3%, while federal debt had reached 122% of GDP. Gold’s present rally has therefore unfolded under very different monetary conditions. Its strength despite rising real yields and relatively moderate inflation suggests that investors may be increasingly concerned about the longer-term stability of the monetary system itself.
The scale of US government debt makes this development particularly significant. Higher real interest rates have traditionally supported demand for dollar assets by offering investors better returns on US government bonds relative to gold. However, with federal debt exceeding 120% of GDP, maintaining those returns becomes increasingly expensive as the government refinances its debt. This creates a difficult trade-off. Lower rates may ease the government’s financing burden but reduce the attraction of dollar assets, while higher rates may sustain investor demand at the cost of increasing debt-servicing obligations.
Gold’s continued appreciation despite rising real yields suggests that investors may be placing greater weight on these longer-term fiscal risks. If this pattern persists, the US could find it increasingly difficult to sustain demand for its debt without adding further pressure to its finances, gradually weakening one of the foundations of the dollar’s global monetary dominance.
Historically, major monetary transitions have often been preceded by prolonged periods of instability. The divergence that emerged in 2022 may be an early indication that such a transition is already underway, as the planet’s monetary constitution gradually changes.

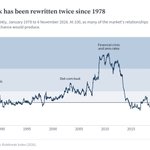
For much of the past 768 years, fixed monetary prices were the prevailing arrangement. Periods of monetary instability repeatedly interrupted this pattern, but each of the four unsettled regimes eventually gave way to a return to fixed or anchored prices.
The floating monetary regime that emerged in 1968 represents a historical departure. For nearly six decades, the global monetary system has operated without returning to its former fixed-price arrangements. This raises an important question about the durability of the current system and whether the monetary changes unfolding today may signal another transition in the world’s monetary order.

3
36
For much of the past 768 years, fixed monetary prices were the prevailing arrangement. Periods of monetary instability repeatedly interrupted this pattern, but each of the four unsettled regimes eventually gave way to a return to fixed or anchored prices.
The floating monetary regime that emerged in 1968 represents a historical departure. For nearly six decades, the global monetary system has operated without returning to its former fixed-price arrangements. This raises an important question about the durability of the current system and whether the monetary changes unfolding today may signal another transition in the world’s monetary order.
Measured against the previous ten years, gold stood 242% above its average at the January 1980 peak and 137% above it at the February 2026 peak. Inflation was running at 14% in January 1980 and at 3% in February 2026. Federal debt was 31% of the economy then and 122% in February 2026. The 1980 run was a flight from double-digit inflation that the Federal Reserve then broke. The present run grew while inflation was moderate and real yields were rising, which is what makes it unusual.
Gold After the Break
Cross-Asset Intelligence · Research Report | Odunomic Advisory | Macro Research | November 2026

4
262
Measured against the previous ten years, gold stood 242% above its average at the January 1980 peak and 137% above it at the February 2026 peak. Inflation was running at 14% in January 1980 and at 3% in February 2026. Federal debt was 31% of the economy then and 122% in February 2026. The 1980 run was a flight from double-digit inflation that the Federal Reserve then broke. The present run grew while inflation was moderate and real yields were rising, which is what makes it unusual.
Gold After the Break
Cross-Asset Intelligence · Research Report | Odunomic Advisory | Macro Research | November 2026
Gold After the Break
Gold broke from its long-standing relationship with real interest rates in 2022. Since then, real yields have risen 4 percentage points, enough under the old relationship to imply a 71% decline in gold's inflation-adjusted value. Instead, gold rose 92%.
Our latest research examines what drove this divergence, how it compares with three centuries of gold price history, and what could bring the current rally to an end.
Key findings:
1) Real interest rates still affect gold, but their influence is much smaller than the old relationship suggested. Rising yields have reduced gold's value by roughly a quarter since 2022, while stronger demand has added 170%.
2) Central banks are central to this shift. Gold has risen across six major currencies, while reserve accumulation and demand for gold beyond government control have helped sustain the rally.
3) Only one comparable episode exists in 307 years of history: the run that peaked in 1980. Gold subsequently lost 65% of its inflation-adjusted value over five years.
4) Historical reversals suggest that weakening demand, rather than rising interest rates alone, is the critical risk. An estimated $2,609 of gold's $4,146 price is supported by demand accumulated since 2022.
5) Our simulations suggest a 43% to 52% probability that gold will be lower in three years, depending on the demand window examined. Recent demand trends lean toward a reversal, although confidence remains low.
Gold After the Break
Cross-Asset Intelligence · Research Report
Odunomic Advisory | Macro Research | November 2026
#OdunomicAdvisory #OdunomicResearch #Gold #MonetaryPolicy #InterestRates #CentralBankReserves #MacroResearch #CrossAssetIntelligence


Gold After the Break
Gold broke from its long-standing relationship with real interest rates in 2022. Since then, real yields have risen 4 percentage points, enough under the old relationship to imply a 71% decline in gold's inflation-adjusted value. Instead, gold rose 92%.
Our latest research examines what drove this divergence, how it compares with three centuries of gold price history, and what could bring the current rally to an end.
Key findings:
1) Real interest rates still affect gold, but their influence is much smaller than the old relationship suggested. Rising yields have reduced gold's value by roughly a quarter since 2022, while stronger demand has added 170%.
2) Central banks are central to this shift. Gold has risen across six major currencies, while reserve accumulation and demand for gold beyond government control have helped sustain the rally.
3) Only one comparable episode exists in 307 years of history: the run that peaked in 1980. Gold subsequently lost 65% of its inflation-adjusted value over five years.
4) Historical reversals suggest that weakening demand, rather than rising interest rates alone, is the critical risk. An estimated $2,609 of gold's $4,146 price is supported by demand accumulated since 2022.
5) Our simulations suggest a 43% to 52% probability that gold will be lower in three years, depending on the demand window examined. Recent demand trends lean toward a reversal, although confidence remains low.
Gold After the Break
Cross-Asset Intelligence · Research Report
Odunomic Advisory | Macro Research | November 2026
#OdunomicAdvisory #OdunomicResearch #Gold #MonetaryPolicy #InterestRates #CentralBankReserves #MacroResearch #CrossAssetIntelligence
Of gold’s $4,146 price in September 2026, an estimated $2,609 reflects demand accumulated since 2022. Real yields and the dollar alone imply just $1,537.
Three-year simulations put gold at $7,335 if demand persists, $2,973 if it reverses, and $1,437 under a repeat of the post-1980 decline.
Allowing demand to evolve, gold ends lower in 43% of simulated paths using its past-year momentum, rising to 52% using its six-month momentum.
The key uncertainty is how much of gold’s demand-driven premium can endure.

3
231
Of gold’s $4,146 price in September 2026, an estimated $2,609 reflects demand accumulated since 2022. Real yields and the dollar alone imply just $1,537.
Three-year simulations put gold at $7,335 if demand persists, $2,973 if it reverses, and $1,437 under a repeat of the post-1980 decline.
Allowing demand to evolve, gold ends lower in 43% of simulated paths using its past-year momentum, rising to 52% using its six-month momentum.
The key uncertainty is how much of gold’s demand-driven premium can endure.
1) A dollar left in Treasury bills since August 1971, with its interest, now buys 11% of the gold it bought then. Seven times since 1974 that slide has reversed. The seventh reversal began in February 2026.
2) Eight months in, a dollar of cash buys 34% more gold. That matches 2008, the strongest of the six earlier starts. Measured in pounds, it is the fastest of six.
3) Every recovery has come from the same place: gold falling against prices. Interest barely mattered. Gold peaked at $5,405 on 29 January and stood at $3,983 on 29 October, 26% lower.
4) The markets around this turn look most like 1983: rising stocks, a firm dollar, and stocks and bonds moving together. Two things have no precedent at any turn: oil up 50% and the 10-year Treasury down 8% in seven months.
5) Two years after every earlier turn, the dollar was higher, and bonds and equities beat gold in five of six. The exception was 2008. Six episodes are too few to give odds.
6) Full report, Cash Against Gold: [lnkd.in/p/gpmNey4M]
Cash Against Gold
Cross-Asset Intelligence · Research Report
Odunomic Advisory | Macro Research | October 2026
#MacroResearch #Gold #GlobalMarkets #CrossAsset #FinancialMarkets


The Price of Time, Paid in Gold
In nine years since 1973, cash failed to outperform gold in a single nation: 1973, 1974, 1977, 1979, 1980, 1983, 2010, 2020 and 2025. In 2025, the typical nation’s cash holdings lost 26% of their purchasing power in gold, across 82 nations with complete records.
Historically, higher real interest rates offered some protection. A one percentage point increase in the real rate was associated with an additional 31 basis points of annual purchasing power in gold, although the statistical evidence is moderate.
Cash outperformed gold in 60% of years when real rates exceeded 4%, compared with 45% when they fell below −4%.
However, this protection has weakened since 1999. Cash has lost purchasing power in gold on average at every level of real interest rates, including an annual loss of 5% even when real rates exceeded 4%.
Odunomic Advisory | The Price of Time, Paid in Gold (2026)

