

Official tweets from the Wellbeing Research Centre @UniofOxford @HMCOxford. Posts about our interdisciplinary research on #wellbeing.
- Tweets1.5K
- Following485
- Followers3.5K
- Likes1.8K





ALT Image of a boy exercising on playground equipment, overlaid with a definition of the word “health”, which reads: “Physical and mental health are among the strongest predictors of subjective wellbeing, with mental health particularly important in explaining differences in life satisfaction between people.” The graphic is part of the A to Z of Wellbeing series by the Wellbeing Research Centre at the University of Oxford.

ALT Image of the Wellbeing Research Centre’s 2026 Annual Report on a desk, the cover of which features a view of the Siew-Sngiem Clock Tower at Harris Manchester College, Oxford, alongside the text ‘Annual Report 2026’ and the logo of the Wellbeing Research Centre at the University of Oxford.

ALT Image of woman browsing shelves of folded denim jeans, overlaid with a definition of the word “growth”, which reads: “Economic growth is often seen as a measure of progress, but increases in national income do not necessarily mean people become happier or more satisfied with their lives.” The graphic is part of the A to Z of Wellbeing series by the Wellbeing Research Centre at the University of Oxford.

ALT Three line charts presented under the title “EU vs. US 1990-2023, Economy”. Subtitle reads: “The US has pulled further ahead of Europe economically in the past three decades, with faster productivity growth and substantially higher levels of income and wealth.” Individual plots of net national income, household wealth and labor productivity show the US with a large and increasing lead over the EU. The source of the plots is the paper ‘Is Europe a laggard? Comparing the EU and the US using an interdisciplinary well-being framework’, published in the journal Ecological Economics, of which a full citation is provided.

ALT Six line charts presented under the title “EU vs. US 1990-2023, Wellbeing”. Subtitle reads: “Europe has caught up or moved ahead of the US on many measures of wellbeing, including life satisfaction, education, life expectancy and safety.” Individual plots for Human Development Index, life satisfaction and school enrolment show the US with a diminishing lead over the EU. Individual plots for life expectancy, homicides and voice and accountability show the EU with a large and increasing lead over the US. The source of the plots is the paper ‘Is Europe a laggard? Comparing the EU and the US using an interdisciplinary well-being framework’, published in the journal Ecological Economics, of which a full citation is provided.

ALT Three line charts presented under the title “EU vs. US 1990-2023, Equality”. Subtitle reads: “Wellbeing is shared more equally in Europe, with lower inequalities in life satisfaction, income, wealth and health compared with the US.” Individual plots of income and wealth inequality show the EU with a large lead over the US. An individual plot of female share in labor income shows a much more tightly-matched performance. The source of the plots is the paper ‘Is Europe a laggard? Comparing the EU and the US using an interdisciplinary well-being framework’, published in the journal Ecological Economics, of which a full citation is provided.

ALT Three line charts presented under the title “EU vs. US 1990-2023, Sustainability”. Subtitle reads: “Europe's wellbeing is achieved at lower environmental cost, yet both regions fail to meet climate targets and face growing pressures on conditions for future wellbeing.” Individual plots of adjusted net savings and CO2 emissions show the EU with a large lead over the US. An individual plot for Rule of Law shows the US with a large lead over the EU. The source of the plots is the paper ‘Is Europe a laggard? Comparing the EU and the US using an interdisciplinary well-being framework’, published in the journal Ecological Economics, of which a full citation is provided.

ALT Graphic to promote call for abstracts ahead of the 10th IPPA World Congress on Positive Psychology, to take place in Istanbul between 7 and 10 July 2027. The deadline for submissions is 30 November 2026, to be made at www.ippaworldcongress.org.

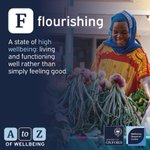
ALT Image of woman at a fruit and vegetable stall, overlaid with a definition of the word “flourishing”, which reads: “A state of high wellbeing: living and functioning well rather than simply feeling good.” The graphic is part of the A to Z of Wellbeing series by the Wellbeing Research Centre at the University of Oxford.

ALT Image of Paul Behrens speaking behind a lectern which reads 'National Emergency Briefing', presented alongside the logo of the Wellbeing Research Centre at the University of Oxford.

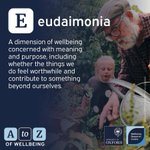
ALT Image of a bearded man helping a young girl water plants, overlaid with a definition of the word “eudaimonia”, which reads: “A dimension of wellbeing concerned with meaning and purpose, including whether the things we do feel worthwhile and contribute to something beyond ourselves.” The graphic is part of the A to Z of Wellbeing series by the Wellbeing Research Centre at the University of Oxford.

ALT A scatter plot presented under the title “Happiness Spread: A Field Experiment”. Subtitle reads: “People who lived with happier peers were no happier themselves eight weeks later, suggesting happiness did not meaningfully spread between roommates.” Figure shows binned scatterplots of happiness of recruits at endline against happiness of other recruits in the same room, where each dot is a bin mean computed from equally many observations, rather than an individual data point. A trend line estimated on all underlying individual-level data shows a flat-to-negative trend. The source of the plot is the paper ‘Does happiness spread within organizations? Evidence from a field experiment in Norway’, published in the Journal of Economic Behavior & Organization, of which a full citation is provided.

ALT Image of a notepad, open on an individual's lap.

ALT Bar chart presented under the title “Meal Sharing and Wellbeing in the USA”. Subtitle reads: “How often we share meals with others can tell us as much about our wellbeing as income or employment status.” Bars present the Cantril Ladder score for Americans who dine with others compared to that of Americans who dine alone. Life evaluations are shown to be significantly higher overall, and when split by both sex and age group. The source of the plot is the paper ‘Sharing meals is associated with greater wellbeing’, published in Scientific Reports, of which a full citation is provided.

ALT Image of two women smiling, overlaid with a definition of the word “drivers”, which reads: “The circumstances and characteristics that help explain differences in wellbeing, including (but not necessarily limited to) our health, relationships, work, wealth and wider social and physical environment.” The graphic is part of the A to Z of Wellbeing series by the Wellbeing Research Centre at the University of Oxford.

ALT Image of two men smiling as part of a group conversation, overlaid with a definition of the word “connection”, which reads: “Social connection comes from our relationships and interactions with family, friends, colleagues and communities. These connections provide companionship, support and a sense of shared experience.” The graphic is part of the A to Z of Wellbeing series by the Wellbeing Research Centre at the University of Oxford.

ALT Two coefficient heatmaps presented under the title “Working Time: Reduce or Compress?”. Subtitle reads: “Reducing working hours is associated with better wellbeing. Compressing the same hours into fewer days shows no benefit, and is associated with declines in women’s wellbeing.” The left plot presents coefficients for both men and women working a ‘true’ four-day week, across 13 domains of wellbeing. The right plot presents coefficients across the same domains for those working compressed hours. Cells are coloured when p is less than 0.1. Shades of purple represent a positive change, while shades of red are negative. Reduced working hours see positive associations for both men and women, but there is a large gender split in the coefficients among women working compressed hours. The source of the plot is the working paper ‘Reduce or Compress? Panel Evidence on Working Time Arrangements and Worker Wellbeing’, of which a full citation is provided.

ALT Image of a group of football players celebrating together, overlaid with a definition of the word “belonging”, which reads: “Feeling accepted, included and valued by others, with a sense that we matter and have a meaningful place within a group or community.” The graphic includes is part of the A to Z of Wellbeing series by the Wellbeing Research Centre at the University of Oxford.

ALT Image of Alberto Prati of the Wellbeing Research Centre at the University of Oxford, alongside the quote: “It is often assumed that happiness is contagious, but our large field experiment suggests that it may not be. Even when people live alongside happier peers, we find no evidence that their own happiness increases.”


ALT Image of four people lying on a picnic blanket, laughing, overlaid with a definition of the word “affect”, which reads: “Psychologists use the word ‘affect’ to describe feelings of different sorts. Positive affect includes feelings of happiness, enjoyment, and laughter. Negative affect includes feelings of sadness, anger and stress.” The graphic includes is part of the A to Z of Wellbeing series by the Wellbeing Research Centre at the University of Oxford.