

Our mission is to invest in scalable technologies that can help the world mature beyond fossil fuels and thereby avoid unsustainable warming. Festina lente.
Earth
Joined February 2022
- Tweets189
- Following14
- Followers155
- Likes7
#German wholesale electricity prices have now fallen most of the way to their pre-war level, and appear to be on a trajectory to continue falling.
Compared to peer European economies, German wholesale electricity prices are trending to the lower end of the distribution.

1
219
Germany continues its progress toward a cleaner, greener, more efficient economy.
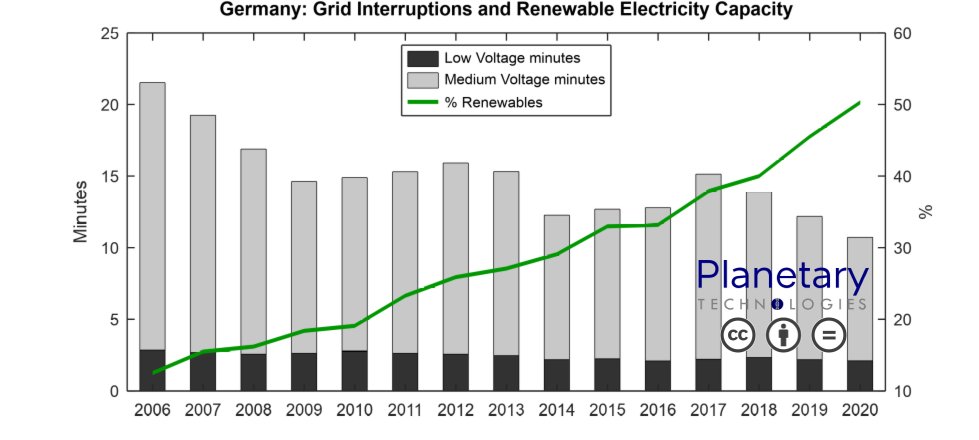
The rise in renewable generation is contemporaneous with 1) an increase in stability of the German grid, 2) an increase in GDP, and 3) a reduction in CO2 equivalent emissions.


1
1,014
Here is a new Research Note in series The Sun Has Won:
China Solar PV Installation Trends And Implications
Full PDF here:
planetarytech.earth/posts/th…

Happy Earth Day! We aim to leave the planet better off than we found it. Our mission is to find scalable technologies that can help the world mature beyond fossil fuels at the pace necessary to avoid unsustainable warming. Roll up your sleeves and join us. Let's get to work.

1
192
Here is the recent chat between @rob_carlson from @PlanetaryOps and @azeem from @ExponentialView about "Entering the Exponential Age" at the @DLDConference in Munich. They discussed exponentials in microchips, biotech, renewable energy, and more.
youtu.be/zjwe-N2RWv8
US biotech revenues are growing quite steeply now, driven by the recovery of crop prices and a large step up in biologics revenues due to RNA vaccines; annual growth is now ~20%, which is quite significant for a sector that is already at least 2.5% if GDP.
planetarytech.earth/bioecono…

Here is latest update to the #Bioeconomy Dashboard: US biotech revenues were at least $552B in 2021, or >2.4% of GDP.
If you apply the multiple for indirect effects from the 2019 NASEM report, the impact would be >$1T, or >5% of US GDP.
planetarytech.earth/bioecono…

"Algae-encoded biopharmaceuticals"
"Development of spirulina for the manufacture and oral delivery of protein therapeutics"
rdcu.be/c1fdM

A reminder that the cost for new renewables is less sensitive to an increasing cost of capital than is any other energy production technology.
Therefore, given the high capex needs of fossil, and the end of growth, rising interest rates will accelerate the shift to renewables.


The incentives in Era 3 are the converse of those in Era 1; going forward, any new fossil fuel combustion capacity installed will be driven by subsidies and policy measures, and will arguably reduce economic competitiveness.

1
2
From 2016 onwards it has become increasingly difficult for a rational economic actor to decide in favor of fossil fuels over renewables. In Era 3, new renewables are clearly more Capital Efficient than fossil fuel combustion.

In Era 2, the “approximate parity” time period, from 2013 up through approximately 2016, it could still be argued that a rational economic actor evaluating new electricity production could choose fossil fuel combustion based on Capital Efficiency.

1
1
In Era 1, the vast majority of PV installations produced less electricity per $ than those burning coal. The global weighted average Capital Efficiency for utility scale PV reached approximate parity with coal for the first time only in 2013, with gas for the first time in 2016.

The German electricity grid became more stable 2006-2020 while the share of renewable electricity generation grew from 6% to 50%. Over that same period, the absolute amount of electricity generated from nuclear and fossil-fueled power fell by 50% and 60%, respectively.
A primary driver of the difference in costs for new build power plants is that the capital costs for new medium- and large-scale PV installations are now as much as seven-fold lower than for new coal- or gas-burning facilities.

1
1

Here I define Capital Efficiency as energy produced per dollar invested or spent over the lifetime of a power plant, in units of MegaWatt*hours per $ (MWh/$).
Thus Capital Efficiency is the inverse of the unsubsidized Levelized Cost of Energy (LCOE) for utility scale generation.

