

Macro & Technical Markets : High-conviction analysis, scenario planning, edge through data + positioning. Not investment advice.
Salt Lake City, UT
Joined May 2022
- Tweets13.9K
- Following656
- Followers3.5K
- Likes7.5K





Pinned Tweet
Introducing the new Polycarp Research Platform 📊
Find the best setups in the market with live dashboards of risk and opportunities, seasonal paths and technicals, and that isn't even the warm up. 👇
The trial is totally free, let me know what you think and hope you enjoy, cheers 🍿 (direct link in the comments)
Polycarp Market Research retweeted

Well, this is getting interesting.
$SMH, $IWM, mid caps and transports are all sitting around their 200-day moving averages.
That's quite a few important parts of the market testing the same long-term trend indicator at once.
Paul Tudor Jones once said, “My metric for everything I look at is the 200-day moving average of closing prices.”
I'm particularly interested in whether $IWM can reclaim its 200DMA here.

Via @VolumeLeaders
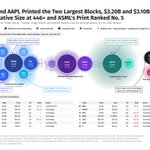
$META and $AAPL with the two largest blocks today
$NVDA $MU are the other stand outs


Who’s ready for oil to peak? Be careful what you ask for. $USO
In 1973, 2000, and 2008 the market followed with a peak of its own
In 1980, 1990, and 2011 the market rallied to new highs $SPY
@VolumeLeaders @fxevolution @dailychartbook

Been a fun year for bond vigilantes
Brazil, France, Japan, Italy, it’s been a world tour 🌎
Every major bond fund is down YTD, and risk is continuing go to get priced in @fxevolution


Polycarp Market Research retweeted
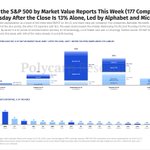
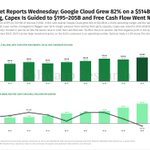
Earnings preview this week 🧵
Amazon reports on Thursday, AWS will be key as usual. $AMZN


Earnings preview this week 🧵
Amazon reports on Thursday, AWS will be key as usual. $AMZN
$MSFT Microsoft to report on Wednesday after going on a run of late. Can the momentum continue?

$GOOG Alphabet earnings on Wednesday, with a 100 year bond issued recently, is there growth risk around the corner?


Polycarp Market Research retweeted

For everyone excited about $TSLA don’t forget about the curse


Polycarp Market Research retweeted

First of many seasonal tailwinds for the S&P 500 begins tomorrow! The 8 trading day period, from 5 days before to 3 days after midterm elections, is incredibly bullish.
Since 1950, $SPX has gained in 18 of 19 instances, with a median return of +2.7%.

ALT Bluekurtic Market Insights heatmap showing S&P 500 performance from 5 trading days before to 3 trading days after U.S. midterm elections since 1950. The S&P 500 posted positive returns in 18 of 19 instances (94.7%), with an average gain of 2.8% and a median gain of 2.7%. The table also displays historical returns, maximum losses, and drawdowns for each midterm election year.


FOMC, PCE, GDP, Megacap Earnings, and any random event such as a Brazilian or French crisis. It’s volatility season. $VIX

$EWZ Brazil has hit its circuit breaker on 20 days since 1997, the S&P fell on 18 of them @fxevolution
$SPY
