

https://xitter.cf/t.co/FlQYb4Em4z is an on going project created to monitor and record #PowerOutages in the #UnitedStates. Follow for updates on major #PowerOutage events.
United States
Joined October 2016
- Tweets1.3K
- Following515
- Followers21.8K
- Likes929


Pinned Tweet
Historical and live power outage data is available on our website for purchase. See poweroutage.us/products for more info.
PowerOutage.us retweeted
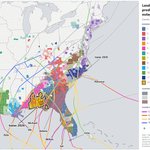
𝟭/ Since 2017, 11 landfalling US hurricanes have each knocked out power to more than 1M customers at once. That’s more than one per season. And 1M customers isn’t 1M people. Each customer averages about 2 people, so that’s roughly 2M people in the dark. 🧵
𝟭/ Since 2017, 11 landfalling US hurricanes have each knocked out power to more than 1M customers at once. That’s more than one per season. And 1M customers isn’t 1M people. Each customer averages about 2 people, so that’s roughly 2M people in the dark. 🧵
𝟱/Nearly every coastal county from Texas to New England has had significant outages from at least one of these storms. Many in Florida, Georgia, and the Carolinas were hit twice.
We ran a power outage simulation for the Great New England Hurricane of 1938. The hurricane made landfall as a category 3 storm in Long Island, NY with a forward speed over 40 mph. Outages would happen fast and we estimated around 9 million customers out at peak with today's power grid. #hurricane #poweroutage #newengland #extremeweather
In 1938, a hurricane tore through New England with almost no warning. If the same storm hit today’s grid, how many people would lose power? We ran the scenario. Here’s what we found. ⚡

Call me Dr. Doomsday - we're doing some research on historic storm events with outage prediction @PowerOutage_us . If a storm like Great New England 1938 storm hit we estimate almost 9 million customer outages. This would be a bad day. NOT A FORECAST. #hurricane #newengland

🌀 900K+ customers lost power in about 12 hours as Hurricane Isaias came ashore.
Outages started before landfall and hit hardest right of the track, where winds were strongest.
Real outage data + observed winds. #HurricaneIsaias
PowerOutage.us retweeted
In preparation for the storms, we've released wind and hurricane path layers on the "Interactive" map type on our website. If you're on mobile, I recommend expanding the map to full screen using the expand button in the bottom left corner (above the use your location icon).

In preparation for the storms, we've released wind and hurricane path layers on the "Interactive" map type on our website. If you're on mobile, I recommend expanding the map to full screen using the expand button in the bottom left corner (above the use your location icon).
The underlying power outage data is available for purchase via an API: poweroutage.us/use-our-data

🌀 Hurricane Isaias: we continue to anticipate significant outage impacts well inland across multiple states.
EM agencies & utilities: track it live with our public outage dashboard. Open, click “Duplicate View,” make it yours.
poweroutage.us/dashboard/pub…

What a windstorm looks like from the power grid's point of view 🌬️ ⚡March 12–14, 2026: wind pushing across nearly 600,000 miles of U.S. power lines. Direction matters as much as speed. A gust hitting a line broadside is a bigger problem.
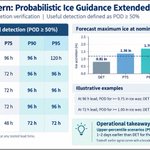
𝟭/𝟱 How far ahead can utilities plan for major storms? Our CIO, Dr. Jason Shafer, explored that question at the EEI TDM&MA conference, looking back at the 2026 storm season. Last up in our series: ice storms. 🧵
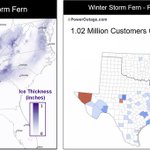
𝟰/𝟱 The most likely forecast consistently underestimated the ice from ensemble smearing. Higher-end scenarios captured the damaging totals days earlier, though they also overforecast ice in some areas that were spared the worst.

𝟱/𝟱 Across thunderstorms, wind storms, and ice, the lesson held: the most likely forecast shows what to expect, and the higher-end scenarios show what to prepare for. What scenario to choose depends primarily on time-based operational constraints. #IceStorm #GridReliability