

Random sports analytics thoughts, mainly on hockey
Joined September 2021
- Tweets16
- Following109
- Followers6
- Likes23




Looking at the average goal difference in wins vs losses, it's interesting to see the disparities in means for the Kraken and Penguins, who generally played well in wins and stuck around during losses, compared to the Capitals (who generally had bad losses and tight wins).

Finally, I looked at the average home ice advantage for every team for the past 5 regular seasons. I'll note that I did not average seasons separately first, so the 20-21 season is less represented due to the shorter length.

Not sure when I'll get to it, but I do want to look at what parts of the game impact home ice most (whether it be the last change, special teams, or intangibles/fans).
I decided to briefly look into how time has impacted home advantage, and found some interesting results. First of all, I expected that home ice would not matter as much in the 20-21 regular season, as I assumed fewer fans would mean less advantage. This was not the case.

While it could be an issue in my treatment of the data, it appears that the season with fewer fans had a higher home ice advantage than surrounding seasons. It is also interesting to note that home ice has lost impact in the past 5 years, although it reboundd slightly last year.
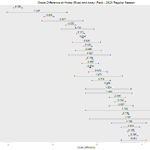
Following from the last two posts, here's the average goal difference between home and away games for each team in the 23-24 regular season. Once again, Edmonton and Colorado stand out significantly.

Similar to last week's post, this chart looks at teams' goal concession during the regular season. COL again shows up as a major outlier, although it is surpassed by CHI and VGK.
Once again, data courtesy of Natural Stat Trick.

