

Daily backtested rule-based strategies. Research since 2012 by Oddmund Grotte & Håkan Samuelsson, both longtime former prop traders Join our Skool Community. ↓
Nordic
Joined July 2021
- Tweets8.1K
- Following170
- Followers22K
- Likes27.2K




Pinned Tweet
8 Quantitative Trading Strategies
(Backtests and Trading Rules)
youtu.be/rlSkRMmycWo
#Quantitative #tradingstrategies

SPY Trading Strategy Using RSI
In this post, we test an RSI-based trading strategy on SPY. The results support our hypothesis: RSI works well on SPY. Even better, we improve the strategy by adding one extra rule.
We backtest the following trading rules:
➤ If RSI(2) is below 15, enter at the close.
➤ Exit at the close when today's close is higher than yesterday's high.
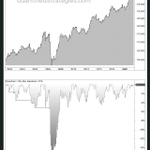
Below is the accumulated profit curve for SPY, which tracks the S&P 500, from 1993 to today (shown in the image).
Can the strategy be improved or tested with different rules? If you have any suggestions, please comment 👇
#TradingStrategies

Every week we send a letter to tens of thousands of traders and investors featuring rule-based trading research, backtested strategies, and market insights.
Sign up here:
tradingstrategiesdaily.com/s…

A 3-Day Gold Strategy With Less Than 10% Max Drawdown
Today, we show you a 3-day gold strategy with a drawdown less than 10%.
The trading rules are extremely simple: One rule to buy and one rule to sell.
A 3-day gold strategy with less than 10% maximum drawdown sounds interesting, and the low drawdown comes from the strategy spending very little time invested.
In this article, we examine a short-term strategy for the gold ETF GLD. Each trade lasts three trading days, and the backtest spends just 7.36% of its time invested. The idea is to capture selected short-term moves in gold.
Across 203 historical trades, the strategy produced an average gain of 0.35% per trade, a win rate of approximately 62%, and a profit factor of 1.97. The maximum drawdown was 9.85%.
The annualized return was a modest 3.22%, but that figure deserves context: the strategy was out of the market more than 92% of the time. For us, this makes it interesting as a potential component of a portfolio of strategies.
Below, we explain the trading rules and examine the results. All figures are historical backtest results before commissions and slippage (which should be close to zero).
A 3-Day Gold Strategy
We backtested following GLD from its inception until today-
· No. of trades: 203
· Average gain per trade: 0.35%
· Average winning trade: 1.1%
· Average losing trade: 0.9%
· Average #daysper trade: 3
· Win ratio: 62%
· Profit factor: 2
· Annual returns (CAGR): 3.2%
· Exposure/time in the market: 7%
· Risk-adjusted return: 43% (CAGR divided by time spent in the market (.07))
· Max drawdown: 10%
Want More Backtested Trading Strategies?
We publish rule-based trading research, systematic market observations, and new trading strategies for traders who prefer evidence over opinions.
Join our Skool community, Rule-Based Trading:
skool.com/rulebasedtrading/a…
We add new strategy research daily and discuss how systematic traders can turn market ideas into rules that can actually be tested.

Trading SPY And S&P 500 Using VIX (Using Vix to trade SPY)
Trading SPY And S&P 500 Using VIX (VIX Trading Strategies). The VIX is a popular measure of the implied volatility of S&P 500 index options. Put shortly, the VIX is a mean reversion indicator: when the risk premium increases (VIX is rising in value) it might be wise to buy stocks and sell when VIX drops in value.
The VIX measures how much investors expect the stock market to swing up or down. When it goes up, it might be a good time to buy stocks, and when it goes down, it could be a good time to sell. This article talks about different ways to trade based on the VIX’s movements.
In this post, we present backtested VIX trading strategies.
We backtest the following trading rules:
We're using a 10-day moving average for the BB. I like to use short time frames since they are more responsive. First, let's try with a standard deviation of 3 for the upper band. When testing, there is no fills using 3 STD.
Here are the results using a standard deviation of 3 (Shown in the image below)
Can the strategy be improved or made different? If you have any suggestions, please comment 👇
#tradingstrategies

Triple RSI Trading Strategy: Boost Your Win Rate to 90%
Today, we reveal a fresh perspective on RSI with the Triple RSI Trading Strategy. This innovative approach harnesses the power of RSI in a new and modified form, boasting an impressive 90% win rate.
With just 83 trades since 1993, it may seem conservative, but each trade delivers a robust 1.4% gain on average.
We backtest the following modified trading rules:
* The 5-day RSI is below 30, and
* The 5-day RSI reading is down for the third day in a row, and
* The 5-day RSI reading was below 60 three trading days ago, and
* The close is higher than the 200-day moving average, and
* If 1-4 are true, then buy at the close.
* Sell at the close when the 5-day RSI crosses above 50.
We backtest SPY – the ETF that tracks S&P 500. When we put the trading rules above into Amibroker, we get the equity curve shown below.
Can the strategy be improved or made different? If you have any suggestions, please comment 👇
#tradingstrategies

QuantifiedStrategies.com retweeted
SPY Trading Strategy Using RSI
In this post, we test an RSI SPY trading strategy. It turns out that our hypothesis is correct: the RSI works well on SPY. Even better, we improve the strategy by adding one extra indicator.
We backtest the following trading rules:
- If RSI(2) is less than 15, then enter at the close.
- Exit on close if today's close is higher than yesterday's high.
Below is the accumulated profit curve from 1993 until today (Shown in the image)
Can the strategy be improved or made different? If you have any suggestions, please comment 👇
#TradingStrategies

ALT SPY Trading Strategy Using RSI


QuantifiedStrategies.com retweeted
📈 5-Day RSI Strategy on Nasdaq: 18% CAGR with 34% Market Exposure
Can a simple mean-reversion setup generate high historical returns while holding cash nearly two-thirds of the time? This strategy tests a 5-day Relative Strength Index (RSI) pullback model on liquid Nasdaq stocks.
📊 Historical Backtest Performance
(Includes 0.03% per-trade slippage allowance; excludes 2000–2003 bear market)
CAGR (Annualized Return): 18%
Win Rate: 69%
Profit Factor: 1.8
Average Winning Trade: +2.75%
Average Losing Trade: -3.5%
Total Completed Trades: 1,477
Maximum Drawdown: 28%
Market Exposure: 34%
📈 Execution Rules & Constraints
Universe: Liquid Nasdaq-listed stocks.
Filter: Exclude low-priced stocks under $15.
Capacity: Maximum of 3 open positions concurrently.
Signal: Enter on short-term oversold conditions via 5-day RSI.
🔍 Key Lessons for Systematic Traders
Capital Efficiency: Spending only 34% of the time in the market allows remaining capital to be deployed elsewhere or held in yield-bearing assets.
Portfolio Diversification: Combine low-exposure mean-reversion systems with non-correlated trend strategies to smooth portfolio drawdowns.
Forward Incubation: Track promising systems on live, out-of-sample data with frozen rules for 3 to 6 months prior to capital allocation.
💡 Key Takeaway
High win rates and low market exposure make 5-day RSI mean-reversion an attractive portfolio component. However, historical backtests are baselines—always account for execution costs, drawdown limits, and forward validation.
ABOUT QUANTIFIED STRATEGIES
Run by former proprietary traders Håkan Samuelsson and Oddmund Groette, Quantified Strategies has published evidence-based research and backtested strategies since 2012. Our newsletter has 25,000+ subscribers, and our trading books have sold 30,000+ copies.
🚀 Want a more disciplined, evidence-driven trading approach?
Join our Skool community for backtested strategies, quantitative research, and systematic risk management.
👉 Link in bio!
#RSIStrategy #MeanReversion
3 Days Down Overnight Trading Strategy (S&P 500, Nasdaq, Rules, Performance, Video):
Here is a simple mean reversion strategy for SPY that holds the S&P 500 overnight, from the close to the next day’s open. It’s one of the simplest approaches to testing overnight trading strategies.
We backtest the following trading rules:
➤ SPY must be down three days in a row (from close to close).
➤ Enter at the close of the third down day.
➤ Exit at the next day’s open.
Below is the equity curve for SPY, which tracks the S&P 500, from 1993 to today (backtested in AmiBroker).
Can the strategy be improved or tested with different rules? If you have any suggestions, please comment 👇
#tradingstrategies

ALT 3 Days Down Overnight Trading Strategy (S&P 500, Nasdaq, Rules, Performance, Video):
Best Day Trading Strategies:
Most day traders use intraday data for backtesting and trading, such as 5-minute or hourly bars. But in this example, we’ll use daily bars instead. The reason is simplicity — daily bars are much easier to backtest and trade. In many cases, day trading with daily bars can be a smarter approach!
We backtest the following trading rules:
➤ We short at the open on the last trading day of each month (not the calendar day, but the actual trading day).
➤ We cover at the close.
We backtest the Russell 2000 futures (@RTY) from 2000 through the end of 2021, using 2022 as our out-of-sample test period. We use trading hours from 08:30 to 15:00 Chicago local time.
Here’s how the strategy performed through 2022 (shown below).
Can we improve the strategy or test some variations? If you have any suggestions, please share them in the comments! 👇

ALT Best Day Trading Strategies
📈 5-Day RSI Strategy on Nasdaq: 18% CAGR with 34% Market Exposure
Can a simple mean-reversion setup generate high historical returns while holding cash nearly two-thirds of the time? This strategy tests a 5-day Relative Strength Index (RSI) pullback model on liquid Nasdaq stocks.
📊 Historical Backtest Performance
(Includes 0.03% per-trade slippage allowance; excludes 2000–2003 bear market)
CAGR (Annualized Return): 18%
Win Rate: 69%
Profit Factor: 1.8
Average Winning Trade: +2.75%
Average Losing Trade: -3.5%
Total Completed Trades: 1,477
Maximum Drawdown: 28%
Market Exposure: 34%
📈 Execution Rules & Constraints
Universe: Liquid Nasdaq-listed stocks.
Filter: Exclude low-priced stocks under $15.
Capacity: Maximum of 3 open positions concurrently.
Signal: Enter on short-term oversold conditions via 5-day RSI.
🔍 Key Lessons for Systematic Traders
Capital Efficiency: Spending only 34% of the time in the market allows remaining capital to be deployed elsewhere or held in yield-bearing assets.
Portfolio Diversification: Combine low-exposure mean-reversion systems with non-correlated trend strategies to smooth portfolio drawdowns.
Forward Incubation: Track promising systems on live, out-of-sample data with frozen rules for 3 to 6 months prior to capital allocation.
💡 Key Takeaway
High win rates and low market exposure make 5-day RSI mean-reversion an attractive portfolio component. However, historical backtests are baselines—always account for execution costs, drawdown limits, and forward validation.
ABOUT QUANTIFIED STRATEGIES
Run by former proprietary traders Håkan Samuelsson and Oddmund Groette, Quantified Strategies has published evidence-based research and backtested strategies since 2012. Our newsletter has 25,000+ subscribers, and our trading books have sold 30,000+ copies.
🚀 Want a more disciplined, evidence-driven trading approach?
Join our Skool community for backtested strategies, quantitative research, and systematic risk management.
👉 Link in bio!
#RSIStrategy #MeanReversion
Day Trading Price Action Strategy — Overview and Backtest:
A day trading price action strategy refers to the pattern of price movement of an asset. Thus, a day trading price action trading strategy is using patterns of price movements to determine when to enter and exit a trade.
We believe the trading rules are pretty straightforward: we want to enter a position after a series of lower lows and lower highs in a row.
In this backtest, we use three lower lows and three lower highs. We use hourly bars. Let's list the trading rules:
* We use hourly bars.
* We enter at the close when the bar is the third lower low and third lower high in a row.
* We enter a position only at 1030 local NY time.
* We sell at the close of 1600 NY time.
We backtest the WTI crude oil futures contract that is traded on NYMEX. The equity curve (2000-2021) looks like the image shown below.
Can the strategy be improved or made different? If you have any suggestions, please comment 👇
#tradingstrategies

ALT Day Trading Price Action Strategy
MACD AND RSI STRATEGY - 81.41% WIN RATE 📈
The MACD and RSI strategy refers to a trading method that makes use of both indicators in analyzing and trading the markets. The combination of both momentum indicators may give more insight into what the market may do next and how it could move in the future.
We set up a specific MACD and RSI strategy with trading rules so we can backtest it.
* We incorporate both the MACD and RSI indicators, and we also use a third indicator as a mean reversion filter.
*When all three conditions are met, we buy, and we sell when the mean reversion filter reverses (i.e. opposite from the buy criterium).
This is it. It’s not very complicated, but it works well.
The strategy works best on stocks in a specific sector. Below is what the strategy’s equity curve looks like on an ETF.
There are 169 trades, and the average gain per trade is 0.62%. Most years show positive returns, while the negative ones show small losses. The worst year was 2008, with a modest 3.6% loss (compared to 55% for S&P 500).
Can the strategy be improved or made different? If you have any suggestions, please comment 👇
#TradingStrategies

🚨 Gold Moving Average Strategy: Turning $100K into $10M
What if checking the market once a month could outperform buying and holding gold? A long-term backtest demonstrates how a simple trend-following rule can capture long-term moves while reducing drawdowns.
📊 Historical Performance (1971 – July 2020)
Starting Capital: $100,000
🟢 Gold Moving Average Strategy: ~$10,000,000
🔴 Gold Buy-and-Hold: ~$4,000,000
The systematic moving average strategy significantly outperformed passive buy-and-hold over the nearly 50-year period.
📈 Strategy Execution Rules
Calculate Indicator: Compute the 12-month simple moving average (SMA) using monthly close prices.
Buy Signal: Buy/hold gold when its monthly close is above the 12-month SMA.
Cash Signal: Exit to cash when gold closes below the 12-month SMA.
Execution Frequency: Review positions only once per month.
Trend Filter: Incorporates a 250-day rolling filter to identify major market regimes.
💡 Why Trend-Following Works
Participates in Trends: Captures sustained macro bull markets.
Limits Bear Exposure: Switches to cash during major downtrends to preserve capital.
Low Maintenance: Requires zero intra-month chart watching or emotional forecasting.
(Note: Trend strategies still face whipsaws, false signals in sideways markets, and drawdown periods. Past backtests do not guarantee future returns.)
🎯 Key Takeaway
Systematic trading isn't about predicting price—it's about responding to trends using objective rules. When integrated into a diversified portfolio, trend filters help smooth returns and manage overall risk.
ABOUT QUANTIFIED STRATEGIES
Run by former proprietary traders Håkan Samuelsson and Oddmund Groette, Quantified Strategies has published evidence-based research and backtested strategies since 2012. Our newsletter has 25,000+ subscribers, and our trading books have sold 30,000+ copies.
🚀 Want a more disciplined, evidence-driven trading approach?
Join our Skool community for backtested strategies, quantitative research, and systematic risk management.
👉 Link in bio!
#GoldTradingStrategy #SystematicTrading
Larry Connors’ %b Strategy (Bollinger Band) | Trading Strategies Explained
In chapter 5 of Larry Connors‘ book High Probability Trading, published in 2009, there is a trading strategy called %b strategy. 2 years have passed since the book was published and it could be interesting to see if the strategies are still performing well. Larry Connors tested 20 ETFs from their inception up until the end of 2008, while we test from inception until today.
We backtest the following trading rules:
* The close must be above the 200-day moving average.
* The %b must be below 0.2 for the last three (consecutive) days.
* If 1 and 2 are true, buy on the close.
* Exit when the %b closes above 0.8.
We were not able to replicate the results of Connors because we lack his parameters. However, the results are very good in QQQ and SPY, but very few fills. This is the equity curve for QQQ (shown below)
Can the strategy be improved or made different? If you have any suggestions, please comment 👇
#tradingstrategies

SPY Trading Strategy Using RSI
In this post, we test an RSI SPY trading strategy. It turns out that our hypothesis is correct: the RSI works well on SPY. Even better, we improve the strategy by adding one extra indicator.
We backtest the following trading rules:
- If RSI(2) is less than 15, then enter at the close.
- Exit on close if today's close is higher than yesterday's high.
Below is the accumulated profit curve from 1993 until today (Shown in the image)
Can the strategy be improved or made different? If you have any suggestions, please comment 👇
#TradingStrategies
ALT SPY Trading Strategy Using RSI
20 EMA Trading Strategy – Does It Work? (Rules, Setup, Backtest, and Performance)
The Exponential Moving Average (EMA) is a type of moving average (MA) that gives greater weight to the most recent data points. But the question is: Can it be used to develop a profitable trading strategy?
In this article, we look at the 20-day EMA trading strategy, backtest it, and try to improve it by adding another technical indicator.
We backtest the following trading rules:
➤ We buy the asset when the 20-day EMA is below the asset price.
➤ We sell the asset when the 20-day EMA is above the asset price.
We backtested the strategy using SPY, the ETF that tracks the S&P 500. The data is not adjusted for dividends or splits. Below is the equity curve.
Can this strategy be improved or modified? If you have any suggestions, please comment 👇
#TradingStrategies
