

Trader. Nature Lover. Chart enthusiast. Head of Technical Research & Strategy @SchwabResearch & Contributor @SchwabNetwork Imp Discl: https://xitter.cf/t.co/wYzhxp2xt6
Joined August 2025
- Tweets3.8K
- Following218
- Followers12K
- Likes4K




Pinned Tweet
My new weekly article, "Technical Analysis Weekly" made its debut this afternoon!
Read here weekly: schwab.com/learn/story/techn…
Going forward, this weekly article will be published mid-morning on Monday's on Schwab.com
Truly a dream of many years that has come true! 🙌 Thank you Lord and thank you @SchwabResearch 🩵

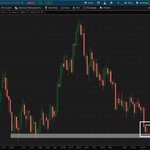
$Gold prices appear to be forming a potential tweezer bottom, a two-candle formation that can develop near the end of a downtrend when both candles establish roughly the same low. Price has also formed an inside day, another setup technicians may watch for signs of a potential reversal.
The two-bar formation is developing near six-month lows, an area that may represent longer-term support for #Gold.
Technicians may look for confirmation of a potential bounce with a CAHOLD (Close Above the High of the Low Day) near 4,050.
*Technical patterns are subject to failure
*Schwab does not recommend the use of technical analysis as a sole means of investment research
*All names and market data shown below are for illustrative purposes only and are not a recommendation, offer to sell, or a solicitation of an offer to buy any security
*Chart source: thinkorswim

The majority of these advancing days in the equity indexes over the month of October have been on lighter-than-average volume. Again today...
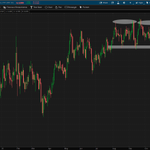
#NDXE #NDX equal-weight appears to be bouncing off neckline support within a potential head-and-shoulders topping formation.
The upward-sloping trendline distinguishes this from a more conventional bearish setup.
*Technical patterns are subject to failure
*Schwab does not recommend the use of technical analysis as a sole means of investment research
*All names and market data shown below are for illustrative purposes only and are not a recommendation, offer to sell, or a solicitation of an offer to buy any security
*Chart source: thinkorswim

These and other technical views are now published in the latest version of "Technical Analysis Weekly": schwab.com/learn/story/techn…

.@RachelDashCS joins #MorningTradeLive and host @sam_vadas to offer technical analysis breakdowns of the S&P 500, semiconductors, and growth vs value.
📽️ The Big 🖼️ on @SchwabNetwork
xitter.cf/i/broadcasts/1AGRnZDqo…

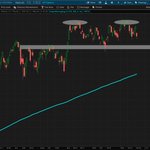
The #Russell2000 appears to be testing a longer-term polarity zone near its 200-day moving average (DMA). This area previously acted as support and may now be acting as resistance.
The last meaningful rebound from the 200-DMA occurred near the March 2026 lows, when the Average Directional Index (ADX) reached an elevated reading. While ADX does not indicate direction, extreme readings (> 40, as seen last week) have historically coincided with mature trends and periods where trend momentum begins to slow or reverse.
*Past performance is no guarantee of future results
*Schwab does not recommend the use of technical analysis as a sole means of investment research
*All names and market data shown below are for illustrative purposes only and are not a recommendation, offer to sell, or a solicitation of an offer to buy any security
*Chart source: thinkorswim


The #Russell2000's 40-week moving average (roughly equivalent to the 200-day moving average) has often acted as support during healthier market environments.
More sustained breaks below this level have historically occurred during periods of heightened volatility and broader market stress, making the current test worth monitoring.
*Past performance is no guarantee of future results
*Schwab does not recommend the use of technical analysis as a sole means of investment research
*All names and market data shown below are for illustrative purposes only and are not a recommendation, offer to sell, or a solicitation of an offer to buy any security
*Chart source: thinkorswim

Dr. Copper appears to be forming a multi-month potential double top formation.
If #Copper breaks below neckline support near 6.35, some technicians may interpret that as evidence of increasing downside pressure in the industrial metal.
*Schwab does not recommend the use of technical analysis as a sole means of investment research
*All names and market data shown below are for illustrative purposes only and are not a recommendation, offer to sell, or a solicitation of an offer to buy any security
*Chart source: thinkorswim

Rachel Dashiell, CFP, CMT retweeted

.@RachelDashCS joins #MorningTradeLive and host @sam_vadas to offer technical analysis breakdowns of the S&P 500, semiconductors, and growth vs value.
📽️ The Big 🖼️ on @SchwabNetwork
xitter.cf/i/broadcasts/1AGRnZDqo…
Chart of the day: #SPX #HighBeta vs #LowVolatility
High Beta stocks relative to Low Volatility stocks appears to be forming a potential double top pattern, with neckline support near prior early-2026 highs and the July corrective lows.
Because this ratio is often monitored as a gauge of investor risk appetite, the recent relative weakness and downside momentum may be worth watching.
If the relative trend continues to weaken, some market participants may view it as a sign of a more defensive tone developing within the equity market.
*Schwab does not recommend the use of technical analysis as a sole means of investment research
*All names and market data shown below are for illustrative purposes only and are not a recommendation, offer to sell, or a solicitation of an offer to buy any security
*Chart source: StockCharts.com

Rachel Dashiell, CFP, CMT retweeted

Miami, you were great! Thanks to everyone who joined us for two days of charts, options and great conversation. Already looking forward to the next one.
Not a recommendation.

Rachel Dashiell, CFP, CMT retweeted
That's a wrap on day one in Miami! Thank you to everyone who joined us for Technical Analysis today. Great questions and even better energy. Tomorrow we dive into options strategies. If you're around, come say hi!


These are the industries that are within 3% of a new yearly high
*Schwab does not recommend the use of technical analysis as a sole means of investment research
*All names and market data shown below are for illustrative purposes only and are not a recommendation, offer to sell, or a solicitation of an offer to buy any security
*Chart source: thinkorswim


Potential long-term support for #Semiconductors #SOX may exist near the 38.2% Fibonacci retracement of the entire 2025-26 advance around 10,350.
The April 2025 correction found support near the 61.8% Fibonacci retracement of the prior advance from the 2022 lows through the 2024 highs.
From an Elliott Wave perspective, one possible interpretation is that the 2022 low represented a cycle reset and that #Semis may be undergoing a corrective wave 4 within a broader 5-wave advance.
*Elliott Wave analysis is subjective, and alternative interpretations may exist
*Schwab does not recommend the use of technical analysis as a sole means of investment research
*All names and market data shown below are for illustrative purposes only and are not a recommendation, offer to sell, or a solicitation of an offer to buy any security
*Chart source: thinkorswim

Chart of the day: $NQ_F
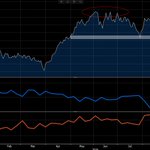
Positioning data in #Nasdaq100 futures may be drawing attention from some technicians. According to COT data, large speculators are near some of their most net-long positioning of the last five years, sitting near the 97th percentile. Perhaps the most notable development is the rapid shift from the 0th percentile in August to the 100th percentile just two weeks ago.
Conversely, commercial hedgers are near some of their most net-short positions of the last five years.
Some technicians may view the combination of elevated speculative positioning and extreme commercial positioning as supportive of a more cautious or bearish outlook.
While positioning data is not predictive and should not be used in isolation, some market participants may interpret these extremes as evidence that downside risks have increased, although past performance is no guarantee of future results.
*Schwab does not recommend the use of technical analysis as a sole means of investment research
*All names and market data shown below are for illustrative purposes only and are not a recommendation, offer to sell, or a solicitation of an offer to buy any security
*Chart source: Bloomberg

Chart of the day: #SPX
The S&P 500 may be forming a potential double top, with neckline support near 7600.
If the pattern were to complete, classical charting techniques would identify a measured objective near a cluster of potential longer-term support, including summertime consolidation lows and the 200-day simple moving average near 7300.
*Technical patterns are subject to failure and price objectives are not guaranteed to be met
*Schwab does not recommend the use of technical analysis as a sole means of investment research
*All names and market data shown below are for illustrative purposes only and are not a recommendation, offer to sell, or a solicitation of an offer to buy any security
*Chart source: thinkorswim

Rachel Dashiell, CFP, CMT retweeted

And for longer-form content you can use, check out the list below...featuring: @RachelDashCS @MarkNewtonCMT @MichaelNaussCMT @RH_Waves @MWellerFX
Find all the the links and subscribe here: content.cmtassociation.org/a…


Today I joined @sam_vadas on @SchwabNetwork to give a run-down of the technicals on the S&P 500 and the Russell 2000.
These and others are published in my brand new "Technical Analysis Weekly" article here every Monday: schwab.com/learn/story/techn…
*Schwab does not recommend the use of technical analysis as a sole means of investment research
*All names and market data shown below are for illustrative purposes only and are not a recommendation, offer to sell, or a solicitation of an offer to buy any security
For in-depth technical analysis of the markets tune in to #MorningTradeLive as @RachelDashCS joins host @sam_vadas.
📽️ The Big 🖼️ on @SchwabNetwork
xitter.cf/i/broadcasts/1PKqrNOPb…

#ConsumerStaples has enjoyed a strong advance, but trend and momentum appear to be easing as the sector approaches potential resistance near the upper end of a nearly 7-month range.
*Technical patterns are subject to failure
*Schwab does not recommend the use of technical analysis as a sole means of investment research
*All names and market data shown below are for illustrative purposes only and are not a recommendation, offer to sell, or a solicitation of an offer to buy any security
*Chart source: thinkorswim

Chart of the day:
Downside momentum in #Technology relative to #SPX appears to be losing steam after a period of relative weakness
*Schwab does not recommend the use of technical analysis as a sole means of investment research
*All names and market data shown below are for illustrative purposes only and are not a recommendation, offer to sell, or a solicitation of an offer to buy any security
*Chart source: thinkorswim
