

The industry-leading data newsletter documenting the story of the stock market. Also on Bloomberg Terminals. Join 200K+ investors.👇
- Tweets2.8K
- Following17
- Followers6.5K
- Likes9K






ALT Line chart of Bloom Energy's share price on the morning of October 23, 2026. The stock starts the session near $205 and slides to $192.74 by 10:06 AM ET, down 11.5% from the prior close of $217.77.


ALT Line chart of Meta's year-over-year capex and revenue growth since 2023. Capex has grown faster for 10 straight quarters, up 80.3% in the third quarter of 2026 while revenue rose 26.1%.


ALT Line chart of stocks held directly and indirectly as a share of financial assets for US households and nonprofits since 1945. The share hit a record 48.2% in the second quarter of 2026, above the 38.7% dot-com peak in the first quarter of 2000.

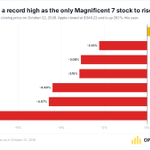
ALT Bar chart of one-day percent changes for the Magnificent 7 stocks on October 22, 2026. Apple rose 1.23% to a record close of $348.22, the only gainer. Microsoft fell 2.23%, Tesla 3.08%, Alphabet 3.15%, Nvidia 4.40%, Amazon 4.57% and Meta 6.98%.

ALT Bar chart of the biggest market value losses in the S&P 500 on October 22, 2026. Nvidia lost $235.2 billion, Amazon $129.3 billion, Alphabet $127.0 billion and Meta $124.0 billion, the fourth most, as Meta stock fell 7.0%.

ALT Line chart of year-to-date total returns for four neocloud stocks from the December 31, 2025 close to the October 22, 2026 close. Nebius is up 90.1% after peaking above 240% in June. Applied Digital is down 22.1%, CoreWeave is down 22.4% and IREN is down 32.5%.

ALT Line chart of Meta's quarterly capex, measured as purchases of property and equipment, and its operating cash flow from the first quarter of 2012 through the third quarter of 2026, in billions of dollars. Operating cash flow stays above capex from the third quarter of 2012 onward. After 2012, the two lines come closest in the third quarter of 2022, at $9.38 billion of capex against $9.69 billion of operating cash flow. Capex then jumps to $30.12 billion in the second quarter of 2026 and $33.94 billion in the third quarter, topping operating cash flow of $32.79 billion. The last time capex was higher was the second quarter of 2012, at $413 million against $242 million.


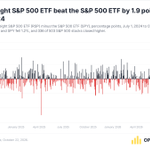
ALT Column chart of the daily return of the equal-weight S&P 500 ETF minus the S&P 500 ETF since July 2024. On October 22 the gap was 1.9 points, the most since July 11, 2024.


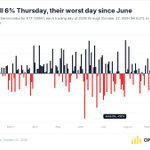
ALT Bar chart of the daily change in the VanEck Semiconductor ETF in 2026. It fell 6.0% on October 22, its biggest drop since a 7.0% fall on June 23.

ALT Line chart of the 30-day correlation of daily returns since SpaceX's IPO. The black line, Tesla with SpaceX, rose from 0.10 in late July to 0.64 on October 21, its highest since SpaceX's IPO. The gray line, Tesla with the S&P 500, was 0.72 on October 21.

ALT Line chart of the percent change in daily closes since the CSI 300's highest close of 2026 on June 22. China's CSI 300 closed 20.2% below that peak on October 22, a bear market, while the S&P 500 was up 3.8% through October 21.

ALT Column chart of Meta's quarterly operating cash flow and capital spending, in billions of dollars, from the fourth quarter of 2023 through the third quarter of 2026. In the third quarter of 2026, capital spending of $33.94 billion topped operating cash flow of $32.79 billion, the first time since 2012.

ALT Western Digital's stock move in the first trading session after each of its last 8 earnings reports. It fell after the last 3, including drops of 10.1% in January 2026 and 13.0% in August 2026.

ALT Line chart of the 30-day correlation of daily returns since SpaceX's IPO. The black line, Tesla with SpaceX, rose from 0.10 in late July to 0.64 on October 21, its highest since SpaceX's IPO. The gray line, Tesla with the S&P 500, was 0.72 on October 21.
