

Weather/climate analyzer and forecaster. Info on global weather models, weather patterns, winter, stratosphere, polar vortex, custom graphics, and more...
Slovenia
Joined July 2010
- Tweets3K
- Following217
- Followers2.1K
- Likes2.9K




Pinned Tweet
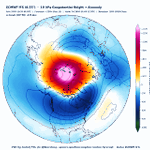
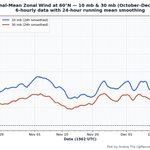
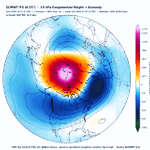
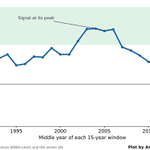
The 00z ECMWF continues its Stratospheric Warming (SSW) assault on the Polar Vortex, still showing a proper wind reversal, and now it almost reaches a wind reversal down to 50mb.
At the same time, other single model runs are still conservative about a reversal, probably rightfully so, while the GEFS extended run is just in its own world again. The models split around October 29, so in the next few runs or days, we should get a clear picture.
All images are available live and updated in my Polar Vortex hub, link in the comments below 👇


Monitor the Polar Vortex yourself in detail in my Polar Vortex hub: severe-weather.eu/polar-vort…

Wow! Latest ECMWF 12z is going all out in the stratosphere, now forecasting an actual Stratospheric Warming event with a wind reversal, making it an official SSW event.
It will likely not remain at this, as this would be an unprecedented event, and the model trend map shows quite a spread between the last runs. But even seeing this suggested at this time is really insane.
All the maps are available in my Polar Vortex hub (link in the comments)
@judah47
I have seen you noticed the 12z ECM, but did you know it also has a proper reversal? 😁


You can also monitor this ongoing development yourself in the Polar Vortex hub: severe-weather.eu/polar-vort…
How accurate are Polar Vortex forecasts really? I created new graphics that will answer this question over the whole 2026/2027 season, with the first real test coming in the coming days.
The graphics are already live in my Polar Vortex hub, under the "Forecast Accuracy" tab, and update twice per day.
severe-weather.eu/polar-vort…
Every line on the charts is one forecast a model made, and the black line is what actually happened. When the forecast lines keep landing above or below the analysis line, you can see whether a model tends to forecast the #polarvortex too strong or too weak.
I am monitoring the ECMWF, GFS, and AIFS, plus their ensembles. You can view the last 30 days, or the full season from late September to April, which fills in as the season goes on.
The first real test is starting right now: the models show the Polar Vortex weakening sharply into early November, with a general trend towards weaker Polar Vortex coming from ECMWF


I decided to already do some upgrades on my Polar Vortex monitor/forecast page (link below), so I added 4 new visual products and a status bar which tells right away in what state the #polarvortex is.
The 4 new products are a heat flux map, an ensemble SSW probability map, an SSW analog years map, and what I am most proud of, a 3D Polar Vortex forecast animation from live GFS data, updating every run.
I am really grateful that I got very good feedback on my Polar Vortex monitor/forecast page today, so thanks to everyone that tried it out and finds the products useful!
Here is the direct link to the page for anyone that want to try it out: severe-weather.eu/polar-vort…


Not sure how X handles these links, as I am not otherwise a regular user here, so I got suggestions to rather post the link in the comments: severe-weather.eu/polar-vort…
Looking at the latest SAI forecast, October is aiming to end on a high note.
Combining observations and forecast, the final October SAI is heading for around +1.2 sigma. This is well above-normal snow advance, with only a handful of Octobers advancing faster in the last 27 years (2009, 2012, 2014, 2015, 2016).
A strong SAI is one ingredient for a weaker #polarvortex in winter, though the link has been less reliable in recent years. But with the Polar Vortex now having some unusual struggles, a Super El Niño on the rise, and now SAI, we are really in a period that gets you excited if you are a seasonal weather observer! 🙏
@judah47

The #PolarVortex is forecast to weaken to record lows in early November, giving us something interesting to watch. The 00z ECMWF and GFS are now in pretty much perfect sync to reach well below the previous low.
For that reason, I decided to share my Polar Vortex monitoring page openly, with more products already in development. It updates twice per day, so you can track the latest Polar Vortex development yourself as we head towards Winter. 👇
severe-weather.eu/polar-vort…


A more direct link to the Polar Vortex monitor page: severe-weather.eu/polar-vort…
We often now talk about the Polar Vortex, but it is not easy to visualize it in your head. For that reason I decided to make a 3D visualization from the latest GFS data, highlighting the Polar Vortex structure, and wave1/2 "attack" on the Polar Vortex in the coming days.
You can see the core separation, and the upward-style of the event.
@judah47 @Superchri90 @RyanWeather @webberweather
#polarvortex #winter
How weak can the Polar Vortex be in early November, and why is 2026 a big Polar Vortex outlier? 🌀
The latest operational forecasts are aiming for a record (or near-record) weak Polar Vortex, centered on November 5th.
The 10 weakest 10 mb 60°N zonal-mean winds for Nov 3-7 mean since 1958 (ERA5):
2004 (14.4 m/s), 2016, 1960, 1964, 2005, 1979, 1996, 2009, 1993, 1977.
Some stats:
📉 A weak start did not signal a weak winter Polar Vortex: only 3 of these 10 winters had a major sudden stratospheric warming (2006, 1980, 2010), which is below-average frequency.
💪 Several flipped to a strong Polar Vortex later: 2004/05 averaged 44 m/s in Dec–Feb (normal is 28), and 1996/97 turned into one of the coldest, most persistent Polar Vortex events on record.
🌊 There is also no strong El Niño on the list. Strong El Niño autumns actually had a strong vortex in early November: 2015 ranks 4th strongest of 67 years, and 1997 is also in the top 10 strongest. This makes the 2026 event kind of an outlier, as it is aiming for the opposite signal with one of the weakest Polar Vortex events at that time, but during a likely record strong Super El Niño.
QBO split 6 east / 4 west: no clear link.
And the troposphere? I attached a plot that shows the 500 mb composite of all 50 days (Nov 3-7 in each of the low 10 years). Right: the ECMWF ensemble for Nov 3–5 2026.
The match is close to zero, apart from some overlap over the central United States and the Arctic, but Europe is the opposite: a trough in the weak-vortex years vs a strong Scandinavian high in the forecast.
Bottom line: an early-November weak Polar Vortex isn't a reliable predictor, either for the rest of winter or for the weather pattern at the same time.


The latest round of Polar Vortex 60N wind forecasts is now aiming for a consensus, with "peak" weakening projected around November 5th. This follows an upward reflective wave-2 event, creating a Polar Vortex disruption and a core separation. Even the GEFS extended run has finally caught up to the proper trend.
P.S.: All these products (and some more) will soon be available operationally online.
#polarvortex #winter


Thanks to a big jump in the latest IMS snow analysis, the latest SAI forecast and the final slope estimate got a bit of a boost in the latest run, showing a decent above average Snow Advance Index.
NOTE: There are some changes in the IFS snow depth (sd) parameter packaging since the 12z run, along with the addition of 0.1° model output. Effectively, they slightly increased the minimum SWE (snow-water equivalent) threshold needed before a grid box is marked as snow-covered, though calibration against observations keeps the forecast curve in check.
@judah47

A split Polar Vortex in early November? 👀
The latest ECMWF 00z shows two vortex cores/lobes at 10mb, over northern Eurasia and Canada, with a wave-2 ridge cutting in-between. The same pattern reaches down to 50mb, so it’s not just an upper-level feature, but an upward reflective event.
Both ECMWF and GFS push 60°N/10mb winds below the historical minimum (5–11 m/s by Nov 4-5).
Even the GEFS extended mean, with its usual strong-SPV bias, is trending weaker in the latest available data.
#PolarVortex #Winter2026


Polar vortex outlook for winter 2026/27: El Niño analogs vs ECMWF SEAS5 🌀
Polar cap (60-90°N) temperature anomaly, Oct-Apr, from the surface to the stratosphere.
📊 Analogs (strong East-Pacific El Niño years 1997, 2015, 1982, 1957; NOAA CORe):
A cold, strong polar vortex from November through most of January. Then a sharp stratospheric warming in late January / early February that works its way down towards the lower stratosphere by March.
ECMWF SEAS5 (October run, 51 members):
The same overall story: a cold vortex in November and December, then a strong warming signal that arrives earlier, from late December, peaking in January and reaching below 100mb by February.
The takeaway: both point to a strong vortex in early winter, followed by a vortex disruption in mid-to-late winter. The main difference is timing: SEAS5 brings the warming about a month earlier than the analogs.
A weaker vortex in late winter raises the odds of a negative AO / NAO pattern and cold outbreaks into mid-latitudes, but the timing is uncertain at this range.
Also, the analogs are only 4 years, with high variance.
@judah47 @webberweather @RyanWeather


Pattern repeat: how the 500 mb pattern evolves from November to December in strong East-Pacific El Niño analog years 🌍
ERA5 analog composite for 2026/27 (1997, 2015, 1982, 1957), weighted by how closely each year's Jul–Sep SST pattern matches 2026.
🇺🇸 United States: the November pattern repeats and amplifies (r = 0.61).
Both months show lower heights over the West and South and a ridge over the East. In November it's a trough over the Southwest and a weak East Coast ridge. In December the trough slides towards Texas and the Gulf, and the ridge grows into a strong high over the Great Lakes and the Northeast. Upstream, a deep low develops over Alaska and the Bering Sea, the classic strong El Niño signal. That means a mild northern and eastern US, with the storm track favoring the southern tier. This is something that @webberweather already mentioned as "Merry Torchmas"
🇪🇺 Europe: the same pattern in both months (pattern correlation r = 0.91). High pressure is anchored over central Europe in November and simply strengthens into December, spreading across the Alps, the Balkans and the Mediterranean. The Atlantic trough stays in place but shifts north, from west of Ireland towards Iceland, keeping the storm track over the northwest. That points to a persistent mild and mostly dry regime for central and southern Europe, wetter for the British Isles and Norway.
The bottom line for both regions: whatever sets up in November tends to lock in and strengthen into December. Keep in mind that analogs show tendencies, not forecasts.


