

The world runs on resources. I analyze them. Weekly map on Substack. Not financial advice.
Joined December 2021
- Tweets1.3K
- Following156
- Followers7.9K
- Likes664




Pinned Tweet
This is one of the cleanest multi-year setups in the entire commodity space.
Look at the Bloomberg Commodity Index.
A massive cup-and-handle pattern stretching back over a decade is now pressing against resistance near 138.
If this breaks and holds, it won’t be a quiet move.
History shows these kinds of structures on the broad commodity complex tend to unleash a powerful, multi-month wave higher across energy, metals, and softs.
That means:
• Sticky inflation returning through the physical cost of living
• Central banks trapped between rising prices and soaring debt costs
• Accelerating capital rotation out of paper assets into real ones
The paper narrative of “cooling inflation” is about to collide with physical reality.
The breakout, if confirmed, changes the entire macro regime.
Physics > Paper.

Asia just wiped out a ton of shorts on gold.
This flush took us straight into the target I laid out on my Sunday Substack- way faster than I expected.
It was done on very low volume.
Looks planned. Good chance we reverse hard and leave the street behind.

Northstar thinks gold miners are resuming their downtrend vs oil.
The chart says otherwise.
I still see a multi-year resistance breakout + successful retest so far.
Price is consolidating above the old line.
I’m bullish on energy too - but the miners chart vs oil still looks constructive to me.


1
7
1,031
The U.S. Strategic Petroleum Reserve is now at levels last seen in 1982.
Back then we were still filling it.
Today we’ve drained it back to the same level.
This has never happened before.
At current U.S. consumption, that’s about 13 days of oil left in the reserve.
And the Strait of Hormuz still isn’t fully open - while aircraft carriers are gathering in the Middle East.

Today hard assets detached from the falling indices.
That’s simply capital being reallocated from stocks into hard assets.
Is this a permanent shift? No idea — and honestly, I don’t really care. As a long-term investor I know we’re headed there anyway.

Platinum vs SPX
$Platinum broke out of a 10-year downtrend versus the S&P 500. The breakout was clean — now price is pulling back into the zone it left.
This is the test.
Hold above this area and we get the first real evidence that platinum’s relative strength versus equities is shifting. Lose it and the breakout was a fakeout.
I’m watching the level. Not calling it yet.

Silver is moving fast toward the 45 zone I mapped out in Sunday’s note.
Full breakdown of the dollar, metals targets, and why miners are still holding up relatively well:
resourcealpha.substack.com/p…
If you haven’t read it yet — worth a look before we get there.

Dollar just closed a strong weekly candle.
Is this the time to start adding metals, or still too early?
Metals can still bleed from here — silver toward 45, gold potentially toward 3500.
But miners are holding up unusually well vs the metals themselves. GDX/Gold and SIL/Silver are sitting right in front of relative breakouts despite the stronger dollar.
I’m not selling. I’m a long-term holder waiting to add once the correction shows signs of ending. Charts say further downside is possible, but geopolitics can flip a short-term trend fast after moves like this.
Full breakdown + the ratio charts in the note.
(Link in comments)

Told you not to get excited packing into this Bitcoin bounce.
-24% and counting.


A week ago I flew to Vietnam with my wife.
Before takeoff I told her straight: the world’s looking pretty tense and there’s a real chance we get stuck there.
We fly home in 4 days. Time will tell.
Not saying everything stops tomorrow. Just that the risk feels high enough right now that a normal return ticket starts looking like an option.

In 24 hours:
1. Iran negotiations reach dead end
2. Global Microsoft outage
3. Mossad Chief visits White House
4. U.S bases in the UK go into lockdown after "drone incursion"
5. And now all flights in the U.S are grounded
I see all the dots, just not sure how to connect them
5
981
Better do not miss this one.
Inverse head and shoulders forming on natural gas producers (FCG).
This is still very early. Extremely rare setups like this on a weekly/monthly timeframe.

7
1,107
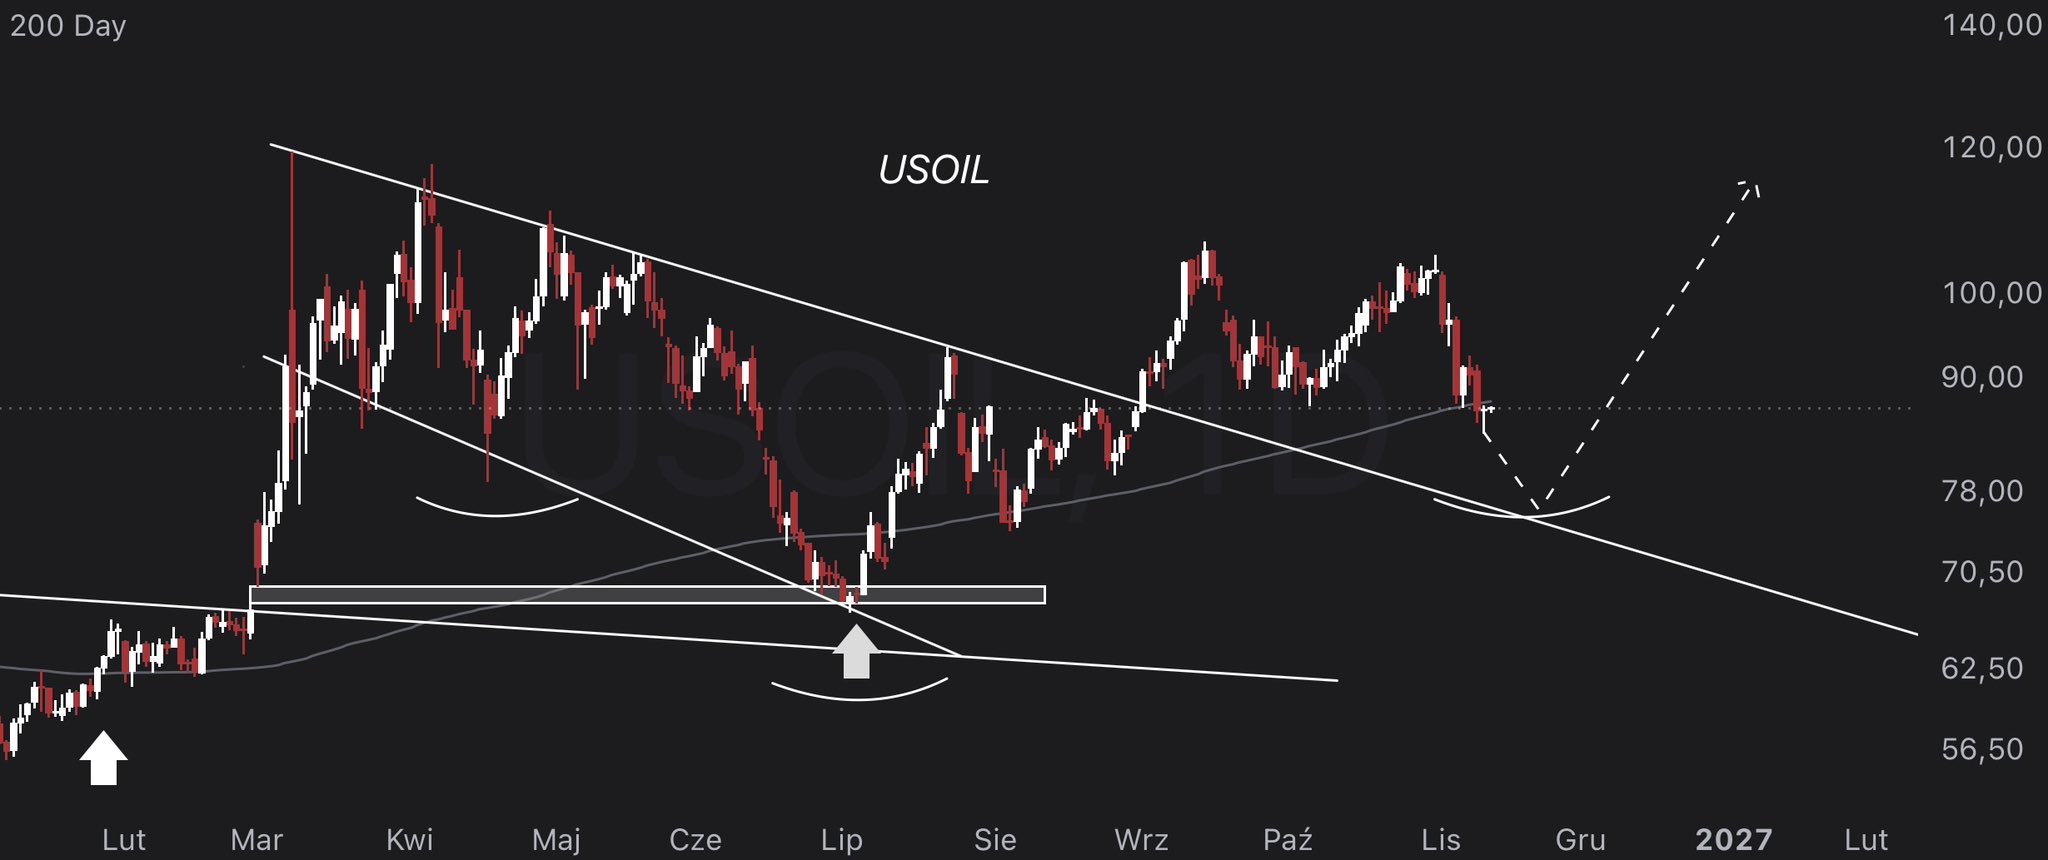
Huge head and shoulders forming on oil.
I’m watching to see if it completes.
The bigger picture hasn’t changed: oil is setting up for a powerful move higher alongside rising inflation. If this pattern plays out, it’s just the final shakeout before that.
For everyone still convinced oil is going back to pre-war levels - just look at how cheap it is versus gold right now.
Gold is already at or very close to the end of its correction.
Soon the rest of the commodity complex starts moving with it. The gap won’t stay this wide for long.

Since that post: multi-year support held.
Natgas already +20% off the lows.
You can only hold a ball underwater for so long.
Funds are still short. One cold snap and this squeezes hard.
We’re right under the wedge.
This is just the beginning.

Natural gas is back at multi-year support.
Europe is heading into winter with storage at multi-year lows. Henry Hub is still the world’s flexible rescue supply. Oil is sitting at these levels, geopolitics are messy - and gas is under $3.
Funds are loaded with one of the biggest short positions in years. One cold headline and this can squeeze hard.
If you’re looking for clean long-term risk/reward, this is it.

3
959
XME just hit the level that decides the next move for miners and metals.
Rising trendline support meets the lower edge of the correction. Hold it and a bounce from oversold conditions is the higher-probability path. Lose it and more downside opens up.
Miners are diverging from the metals. GDX printed a higher high + bullish engulfing candle while gold made a lower low. Same setup on SIL vs silver.
Oil softness would help miners via lower costs — but one Trump decision on Iran flips that instantly.
Two more unloved charts (agriculture and uranium) are sitting at key levels.
Full breakdown with the charts is free in the comments.

2
12
1,503