

Author of 18 books incl. bestsellers Conquer the Crash & Elliott Wave Principle. Personal tweets signed -RP. Managed by @elliottwaveintl. RT ≠ endorsement.
Joined February 2011
- Tweets652
- Following77
- Followers17.1K
- Likes963




Robert Prechter retweeted

A record rally can make risk feel remote.
The S&P 500 Momentum Index tracks the 100 fastest-rising S&P stocks. Its record 44% second-quarter gain shows just how quickly investors’ favorites advanced.
The dot-com comparison on this chart raises a question: What does that strength tell us about risk?
Explore our free report, The Most Dangerous Market in History?, and see which charts are flashing warning signals: ow.ly/2oL25101ltw

Robert Prechter retweeted
Watch this chart - straight from our October Global Market Perspective:
"Even as demand for AI tokens keeps soaring, token prices have collapsed. Silicon Data’s LLM Token Expenditure Index, which tracks what users pay per million tokens, is off 51% since its May 28 peak, and on August 31 it fell below $1 for the first time in its history. Meanwhile, Silicon Data’s H100 Rental Index appears to be topping after climbing 42% from December 1 to August 2. In addition, Nvidia just agreed to pay $12.9 billion for Hugging Face. In other words, demand is soaring, prices are collapsing, and the world’s most valuable company appears to be buying insurance against its best customers."
Identify opportunities, manage risk and stay ahead of major trends in 50+ global markets with your $27 test drive: ow.ly/4bSc50ZZ4mV

The tech stocks influence on the S&P Composite drove the index's annualized dividend yield in August to 1.06%, its lowest ever.
The August 2026 bullet clearly stands out as being further to the right than any year-end bullet plotted on the chart, the most extreme previous reading having occurred at year-end 1999 at 1.13%.

Robert Prechter retweeted
Did Nasdaq just flash a warning?
Yesterday, the index’s low met at the intersection of two converging trendlines.
A clear break below this could be telling.
See our forecasts for stocks, forex, cryptos, gold, silver and 50+ global markets. Test drive Global Market Perspective for just $27: ow.ly/zNIf50ZY5Bc

Robert Prechter retweeted
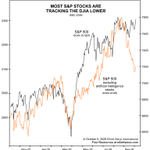
🚨 This breadth measure just delivered its most insistent sell signal since 2000.
This Goldman Sachs indicator measures the gap between the S&P 500 and the median stock in the index.
The September reading was the lowest since the dot-com peak.
Our freshly-updated report dives into 18 eye-opening charts that are flashing warning signals - read it free: ow.ly/I6hx50ZXGNN

Robert Prechter retweeted
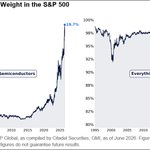
Mega-cap technology stocks are driving the S&P 500.
There were more new one-year lows than highs for 12 straight days.
That kind of narrowing can make an index look healthier than the market underneath it really is.
The question is how long that can continue.
Get free market insights to help you stay ahead of the next move: ow.ly/UlCP50ZWWMZ

Robert Prechter retweeted
Junk is in a funk...
The spread on CCC-rated junk bonds has widened sharply and is now at its widest level in nearly three years.
Historically, widening junk spreads have often preceded weakness in stocks.
The divergence is getting harder to ignore.
See 18 charts that are flashing warning - free: ow.ly/iP2F50ZVTsY

Investors appear to be swapping a broad list of stocks for a few big-name AI stocks.
The effect is visible in the S&P 500.
According to Citadel, Microsoft, Nvidia, Apple and Meta added 300 points to the index in the third quarter, more than twice its net gain.
The other 496 stocks collectively cost the index 150 points.
Breadth statistics are screaming danger.

Robert Prechter retweeted
The market looks strong. But take out technology and the picture changes dramatically.
The Nasdaq 100 Technology Index is up 48% this year, sitting just below its June high.
The Nasdaq 100 Ex-Technology Index? Down 3% for the year and down 9% from its August 19 high.
In other words, a relatively small group of mega-cap tech stocks is doing the heavy lifting.
What happens if tech peaks?
See 18 charts that are flashing warning signs: ow.ly/qMuE50ZUC4S

Robert Prechter retweeted
Everyone loves copper right now. That may be worth watching.
Copper is up 121% since July 2022.
Market Vane’s Bullish Consensus recently reached 90, a 9-year high.
And Large Speculators are now more bullish than at any point in 23 years.
Read the new Financial Forecast to prepare for copper's next move: ow.ly/i99W50ZUxir

Robert Prechter retweeted
How healthy is the rally?
In 13 of the past 14 sessions, more S&P 500 stocks hit new 52-week lows than new 52-week highs.
Yesterday, 8.55% of S&P 500 stocks hit new 52-week lows, even as the index remained within 1.5% of its all-time high.
The index is holding near its highs. The breadth underneath it is weakening.
Ready for the next move? Read Bob Prechter's August Theorist - FREE - inside our Stock Market Highlights: ow.ly/1NYy50ZRTjj

🚨

Junk bonds continue to sound the alarm.
CCC-rated junk bond spreads are widening while the S&P 500 remains near its August peak.
Historically, when these markets diverge, stocks have eventually caught up with the trend in junk spreads. And the bigger the divergence, the bigger the potential catch-up.
This is a chart we'll be watching closely.
See 18 charts sounding an alarm in the markets: ow.ly/zE1g50ZRtLf

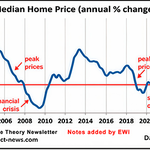
Real estate prices are already slipping.
After real estate prices topped in 2006, the stock market peaked in 2007 and crashed in 2008.
After real estate prices topped in 2019, stocks peaked and crashed in 2020.
The latest real estate boom ended in 2023, so the risk in property values and in stock market prices seem elevated.

Robert Prechter retweeted

German politics is in an uproar and has moved to the extreme far right and far left. This happens after a long period of negative social mood.
The lower panel in the chart shows the relative performance of the Germany iShares MSCI ETF $EWG versus the Vanguard Total World Stock Index ETF $VT. The fact that this political turmoil is happening and that centrist parties like the CDU are getting walloped has been predictable.

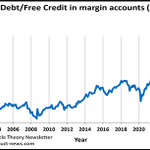
How did valuations get so crazy? Borrowing to buy.
Margin debt relative to free credit balances in brokerage accounts has reached an all-time high of 6.8.
In 2009, it was about 0.8.
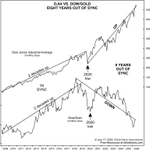
From 2009 to 2026, the DJIA rose 8.5x - which precisely matches the 8.5x multiple of the margin debt/free credit balances ratio.

Robert Prechter retweeted
In 2020, interest rates reached the end of a 39-year decline.
The Fed expected near-zero short-term rates to persist for years.
We saw things differently:
Rates had bottomed. The long decline was over.
Six years later, that call has enormous implications. 🧵

Robert Prechter retweeted
Gold is down more than 9% from its August high. So why are traders still piling into bullish bets?
Outstanding $GLD (the largest gold ETF) calls now outnumber puts by roughly 2.3 million contracts, showing that bullish sentiment has remained remarkably strong even as gold prices have fallen.
That sentiment could shift if gold continues lower.
Test drive the Elliott Wave Financial Forecast Service for just $11 and get our latest forecasts for gold and silver, stocks, interest rates, bonds and more. ow.ly/kv7J50ZNY5Q

Robert Prechter retweeted
30-year yields hit a 22-year high. Was there a sign before the surge?
Go back to December 17, 2024.
That's when EWAVES published this chart showing the 30-Year Treasury yield and an Elliott wave count indicating that a fifth wave higher in rates had begun.
But EWAVES wasn't looking at yields alone.
As Elliott Prechter explains, "I like to have different looks at the same underlying market."
A long-term Treasury ETF was sending a similar signal at the same time - both eerily similar to 2008.
See the charts - ow.ly/1sGS50ZNWA1

Robert Prechter retweeted
March 2026 vs. September 2026.
Back in March:
119^06: Short Term Update identified the top of Intermediate wave (4).
Below 107^04: The forecast for the next major move.
Today:
Below 107.2: Long-bond futures have reached the forecast zone.
5.35%: 30-year Treasury yields have hit their highest level since 2007.
Get a month of forecasts for stocks, bonds, gold & silver, forex and more when you test drive our Financial Forecast Service for just $11: ow.ly/zhah50ZM1Lj


Robert Prechter retweeted
Will tech lead the way down?
The S&P 500 Information Technology Sector topped on June 2.
The S&P 500 followed more than two months later on August 13.
With tech accounting for roughly a third of the index, weakness in the sector could have an outsized impact on the broader market.
Could this be an early warning?
Get the September Financial Forecast, Theorist and 3x/week Short Term Update for just $11 through September 11: ow.ly/XZe250ZKGrV
